Y-chromosome evidence of southern origin of the East Asian-specific haplogroup O3-M122
- PMID: 16080116
- PMCID: PMC1226206
- DOI: 10.1086/444436
Y-chromosome evidence of southern origin of the East Asian-specific haplogroup O3-M122
Abstract
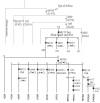
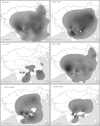
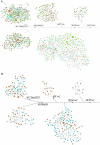
The prehistoric peopling of East Asia by modern humans remains controversial with respect to early population migrations. Here, we present a systematic sampling and genetic screening of an East Asian-specific Y-chromosome haplogroup (O3-M122) in 2,332 individuals from diverse East Asian populations. Our results indicate that the O3-M122 lineage is dominant in East Asian populations, with an average frequency of 44.3%. The microsatellite data show that the O3-M122 haplotypes in southern East Asia are more diverse than those in northern East Asia, suggesting a southern origin of the O3-M122 mutation. It was estimated that the early northward migration of the O3-M122 lineages in East Asia occurred approximately 25,000-30,000 years ago, consistent with the fossil records of modern humans in East Asia.
Figures


Similar articles
-
Extended Y chromosome investigation suggests postglacial migrations of modern humans into East Asia via the northern route.Mol Biol Evol. 2011 Jan;28(1):717-27. doi: 10.1093/molbev/msq247. Epub 2010 Sep 13. Mol Biol Evol. 2011. PMID: 20837606
-
Human migration through bottlenecks from Southeast Asia into East Asia during Last Glacial Maximum revealed by Y chromosomes.PLoS One. 2011;6(8):e24282. doi: 10.1371/journal.pone.0024282. Epub 2011 Aug 31. PLoS One. 2011. PMID: 21904623 Free PMC article.
-
Y chromosome evidence of earliest modern human settlement in East Asia and multiple origins of Tibetan and Japanese populations.BMC Biol. 2008 Oct 29;6:45. doi: 10.1186/1741-7007-6-45. BMC Biol. 2008. PMID: 18959782 Free PMC article.
-
The human genetic history of East Asia: weaving a complex tapestry.Curr Biol. 2010 Feb 23;20(4):R188-93. doi: 10.1016/j.cub.2009.11.052. Curr Biol. 2010. PMID: 20178766 Review.
-
Origin of ethnic groups, linguistic families, and civilizations in China viewed from the Y chromosome.Mol Genet Genomics. 2021 Jul;296(4):783-797. doi: 10.1007/s00438-021-01794-x. Epub 2021 May 26. Mol Genet Genomics. 2021. PMID: 34037863 Review.
Cited by
-
Evolutionary profiles and complex admixture landscape in East Asia: New insights from modern and ancient Y chromosome variation perspectives.Heliyon. 2024 Apr 30;10(9):e30067. doi: 10.1016/j.heliyon.2024.e30067. eCollection 2024 May 15. Heliyon. 2024. PMID: 38756579 Free PMC article. Review.
-
Forensic efficiency and population genetic construction of Guizhou Gelao minority from Southwest China revealed by a panel of 23 autosomal STR loci.Forensic Sci Res. 2024 Jan 5;9(2):owad058. doi: 10.1093/fsr/owad058. eCollection 2024 Jun. Forensic Sci Res. 2024. PMID: 38651135 Free PMC article.
-
Comprehensive insights into the genetic background of Chinese populations using Y chromosome markers.R Soc Open Sci. 2023 Sep 20;10(9):230814. doi: 10.1098/rsos.230814. eCollection 2023 Sep. R Soc Open Sci. 2023. PMID: 37736526 Free PMC article.
-
T2T-YAO: A Telomere-to-telomere Assembled Diploid Reference Genome for Han Chinese.Genomics Proteomics Bioinformatics. 2023 Dec;21(6):1085-1100. doi: 10.1016/j.gpb.2023.08.001. Epub 2023 Aug 16. Genomics Proteomics Bioinformatics. 2023. PMID: 37595788 Free PMC article.
-
Origin and Spread of the ALDH2 Glu504Lys Allele.Phenomics. 2021 Sep 20;1(5):222-228. doi: 10.1007/s43657-021-00017-y. eCollection 2021 Oct. Phenomics. 2021. PMID: 36939783 Free PMC article. Review.
References
Web Resource
References
-
- Cavalli-Sforza LL, Menozzi P, Piazza A (1994) The history and geography of human genes. Princeton University Press, Princeton
-
- Di Giacomo F, Luca F, Popa LO, Akar N, Anagnou N, Banyko J, Brdicka R, et al (2004) Y chromosomal haplogroup J as a signature of the post-Neolithic colonization of Europe. Hum Genet 115:357–371 - PubMed
Publication types
MeSH terms
Substances
LinkOut - more resources
Full Text Sources


