Analysis of human peripheral blood samples from fatal and nonfatal cases of Ebola (Sudan) hemorrhagic fever: cellular responses, virus load, and nitric oxide levels
- PMID: 15367603
- PMCID: PMC516433
- DOI: 10.1128/JVI.78.19.10370-10377.2004
Analysis of human peripheral blood samples from fatal and nonfatal cases of Ebola (Sudan) hemorrhagic fever: cellular responses, virus load, and nitric oxide levels
Abstract
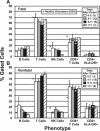
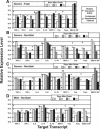
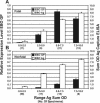
Peripheral blood samples obtained from patients during an outbreak of Ebola virus (Sudan species) disease in Uganda in 2000 were used to phenotype peripheral blood mononuclear cells (PBMC), quantitate gene expression, measure antigenemia, and determine nitric oxide levels. It was determined that as the severity of disease increased in infected patients, there was a corresponding increase in antigenemia and leukopenia. Blood smears revealed thrombocytopenia, a left shift in neutrophils (in some cases degenerating), and atypical lymphocytes. Infected patients who died had reduced numbers of T cells, CD8(+) T cells, and activated (HLA-DR(+)) CD8(+) T cells, while the opposite was noted for patients who survived the disease. Expression levels of cytokines, Fas antigen, and Fas ligand (TaqMan quantitation) in PBMC from infected patients were not significantly different from those in uninfected patients (treated in the same isolation wards), nor was there a significant increase in expression compared to healthy volunteers (United States). This unresponsive state of PBMC from infected patients despite high levels of circulating antigen and virus replication suggests that some form of immunosuppression had developed. Ebola virus RNA levels (virus load) in PBMC specimens were found to be much higher in infected patients who died than patients who survived the disease. Similarly, blood levels of nitric oxide were much higher in fatal cases (increasing with disease severity), and extremely elevated levels (>/=150 microM) would have negatively affected vascular tone and contributed to virus-induced shock.
Figures


Similar articles
-
Blood chemistry measurements and D-Dimer levels associated with fatal and nonfatal outcomes in humans infected with Sudan Ebola virus.J Infect Dis. 2007 Nov 15;196 Suppl 2:S364-71. doi: 10.1086/520613. J Infect Dis. 2007. PMID: 17940972
-
Defective humoral responses and extensive intravascular apoptosis are associated with fatal outcome in Ebola virus-infected patients.Nat Med. 1999 Apr;5(4):423-6. doi: 10.1038/7422. Nat Med. 1999. PMID: 10202932
-
Cytokine and chemokine expression in humans infected with Sudan Ebola virus.J Infect Dis. 2007 Nov 15;196 Suppl 2:S357-63. doi: 10.1086/520611. J Infect Dis. 2007. PMID: 17940971
-
[Ebola and Marburg hemorrhagic fever viruses: update on filoviruses].Med Trop (Mars). 2011 Apr;71(2):111-21. Med Trop (Mars). 2011. PMID: 21695865 Review. French.
-
Camouflage and misdirection: the full-on assault of ebola virus disease.Cell. 2014 Oct 23;159(3):477-86. doi: 10.1016/j.cell.2014.10.006. Epub 2014 Oct 16. Cell. 2014. PMID: 25417101 Free PMC article. Review.
Cited by
-
Afucosylated anti-EBOV antibody MIL77-3 engages sGP to elicit NK cytotoxicity.J Virol. 2024 Sep 17;98(9):e0068524. doi: 10.1128/jvi.00685-24. Epub 2024 Aug 20. J Virol. 2024. PMID: 39162435 Free PMC article.
-
Vascular dysfunction in hemorrhagic viral fevers: opportunities for organotypic modeling.Biofabrication. 2024 Jun 5;16(3):032008. doi: 10.1088/1758-5090/ad4c0b. Biofabrication. 2024. PMID: 38749416 Free PMC article. Review.
-
Rhabdomyolysis, Acute Kidney Injury, and Mortality in Ebola Virus Disease: Retrospective Analysis of Cases From the Eastern Democratic Republic of the Congo, 2019.J Infect Dis. 2024 Aug 16;230(2):e465-e473. doi: 10.1093/infdis/jiae224. J Infect Dis. 2024. PMID: 38696335 Free PMC article.
-
Peripheral immune responses to filoviruses in a reservoir versus spillover hosts reveal transcriptional correlates of disease.Front Immunol. 2024 Jan 8;14:1306501. doi: 10.3389/fimmu.2023.1306501. eCollection 2023. Front Immunol. 2024. PMID: 38259437 Free PMC article.
-
Ebola Virus Uses Tunneling Nanotubes as an Alternate Route of Dissemination.J Infect Dis. 2023 Nov 13;228(Suppl 7):S522-S535. doi: 10.1093/infdis/jiad400. J Infect Dis. 2023. PMID: 37723997 Free PMC article.
References
-
- Baize, S., E. M. Leroy, E. Mavoungou, and S. P. Fisher-Hoch. 2000. Apoptosis in fatal Ebola infection. Does the virus toll the bell for immune system? Apoptosis 5:5-7. - PubMed
-
- Baize, S., E. M. Leroy, M.-C. Georges-Courbot, M. Capron, J. Lansoud-Soukate, P. Debré, S. P. Fisher-Hoch, J. B. McCormick, and A. J. Georges. 1999. Defective humoral responses and extensive intravascular apoptosis are associated with fatal outcome in Ebola virus-infected patients. Nat. Med. 5:423-426. - PubMed
MeSH terms
Substances
LinkOut - more resources
Full Text Sources
Other Literature Sources
Medical
Molecular Biology Databases
Research Materials
Miscellaneous


