iBet uBet web content aggregator. Adding the entire web to your favor.


Link to original content: https://pubmed.ncbi.nlm.nih.gov/14633608/
Pathogenesis of Ebola hemorrhagic fever in cynomolgus macaques: evidence that dendritic cells are early and sustained targets of infection - PubMed Skip to main page content
U.S. flag

An official website of the United States government

Dot gov

The .gov means it’s official.
Federal government websites often end in .gov or .mil. Before sharing sensitive information, make sure you’re on a federal government site.

Https

The site is secure.
The https:// ensures that you are connecting to the official website and that any information you provide is encrypted and transmitted securely.

Access keys NCBI Homepage MyNCBI Homepage Main Content Main Navigation
. 2003 Dec;163(6):2347-70.
doi: 10.1016/S0002-9440(10)63591-2.

Pathogenesis of Ebola hemorrhagic fever in cynomolgus macaques: evidence that dendritic cells are early and sustained targets of infection

Affiliations

Pathogenesis of Ebola hemorrhagic fever in cynomolgus macaques: evidence that dendritic cells are early and sustained targets of infection

Thomas W Geisbert et al. Am J Pathol. 2003 Dec.

Abstract

Ebola virus (EBOV) infection causes a severe and fatal hemorrhagic disease that in many ways appears to be similar in humans and nonhuman primates; however, little is known about the development of EBOV hemorrhagic fever. In the present study, 21 cynomolgus monkeys were experimentally infected with EBOV and examined sequentially over a 6-day period to investigate the pathological events of EBOV infection that lead to death. Importantly, dendritic cells in lymphoid tissues were identified as early and sustained targets of EBOV, implicating their important role in the immunosuppression characteristic of EBOV infections. Bystander lymphocyte apoptosis, previously described in end-stage tissues, occurred early in the disease-course in intravascular and extravascular locations. Of note, apoptosis and loss of NK cells was a prominent finding, suggesting the importance of innate immunity in determining the fate of the host. Analysis of peripheral blood mononuclear cell gene expression showed temporal increases in tumor necrosis factor-related apoptosis-inducing ligand and Fas transcripts, revealing a possible mechanism for the observed bystander apoptosis, while up-regulation of NAIP and cIAP2 mRNA suggest that EBOV has evolved additional mechanisms to resist host defenses by inducing protective transcripts in cells that it infects. The sequence of pathogenetic events identified in this study should provide new targets for rational prophylactic and chemotherapeutic interventions.


Figures

Figure 1.
Figure 1.
Representative cutaneous rashes from cynomolgus monkeys experimentally infected with EBOV-Zaire. A: Characteristic petechial rash of the right arm at day 4. B: Petechial rash of the inguinal region at day 5.
Figure 2.
Figure 2.
Hematology values after infection of cynomolgus monkeys with EBOV-Zaire. Total white blood cell counts (left) and differential white blood cell counts (center) show a developing leukocytosis due to an increased neutrophilia. Also, note concomitant lymphopenia. PMN, polymorphonuclear neutrophils; Lymphs, lymphocytes. Right: Development of thrombocytopenia and D-dimers.
Figure 3.
Figure 3.
Flow cytometric analysis of cynomolgus monkey peripheral blood mononuclear cells after EBOV-Zaire infection. Note rapid decline in population of NK cells (blue fraction) by days 3 and 4.
Figure 4.
Figure 4.
Clinical chemistry values after infection of cynomolgus monkeys with EBOV-Zaire showing elevated levels of serum enzymes primarily at the late stages of disease (days 5 and 6). Left: Blood urea nitrogen (BUN) and creatinine. Center: γ-glutamyl transferase (GGT) and ALP (alkaline phosphatase). Right: Alanine aminotransferase (ALT) and aspartate aminotransferase (AST).
Figure 5.
Figure 5.
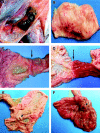
Representative gross necropsy lesions from cynomolgus monkeys experimentally infected with EBOV-Zaire. A: Mild enlargement and marked congestion/hemorrhage of inguinal lymph nodes at day 4. B: Multifocal to coalescing hemorrhages of mucosa of urinary bladder at day 5. C and D: Progression of marked congestion of the duodenum occurring between day 3 (C) and day 5 (D). Arrows indicate the gastroduodenal junction demarcating the stomach to the left and the duodenum to the right. The duodenum is markedly congested at day 5 (D). E and F: Progression of congestion of cecum occurring between day 3 (E) and day 5 (F). The cecum is opened up and the ileum extends outward from the cecum. Arrowheads indicate the ileocecal junction. Note the congested and thickened appearance of the cecum at day 5 (F).
Figure 6.
Figure 6.
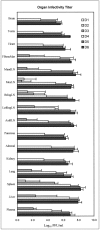
Mean infectivity of cynomolgus monkey plasma and tissue homogenates (10% w/v) inoculated with EBOV-Zaire. LN, lymph node.
Figure 7.
Figure 7.
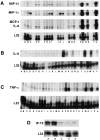
Analysis of mRNA of cynomolgus monkey PBMC before and after infection with EBOV-Zaire. Representative RNase protection assays are shown. A: Chemokines. Comparison of preinfection PBMC (lanes A, D, F, J, M, P, T) with PBMC at postinfection day 1 (lanes B, E, G); day 2 (lanes H, N, R); day 3 (lanes C, I, K, O); day 4 (lanes L and Q); day 5 (lane U); and day 6 (lane S). B: IL-6. Comparison of preinfection PBMC (lanes A, D, F, I, L, P, R, T, V, X) with PBMC at postinfection day 1 (lanes B and G); day 2 (lanes C, E, J, M); day 3 (lanes H and K); day 4 (lanes N, Q, S); day 5 (lanes U and W); and day 6 (lanes O and Y). C: TNF-α. Comparison of preinfection PBMC (lanes A, C, F, H, K, N, R, T, V, X, Z) with PBMC at postinfection day 1 (lanes B, D, I); day 2 (lanes E, G, L, O); day 3 (lanes J and M); day 4 (lanes P, S, V); day 5 (lanes W and Y); and day 6 (lanes Q and a). D: IP-10. Comparison of PBMC at postinfection day 1 (lane A), day 3 (lane B), day 4 (lane C), day 5 (lane D) and day 6 (lane E).
Figure 8.
Figure 8.
Analysis of cytokine/chemokine and nitrate accumulation in serum/plasma of EBOV-Zaire-infected cynomolgus monkeys.
Figure 9.
Figure 9.
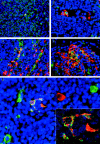
Immunofluorescence staining of inguinal lymph nodes of EBOV-Zaire-infected cynomolgus monkeys for cell markers and EBOV. A: Double labeling for a macrophage marker (green) and EBOV antigens (red). Areas positive for both macrophage markers and EBOV antigens are stained gold as shown in the single EBOV-positive macrophage at day 3. B and D: Double labeling for a dendritic cell marker (DC-SIGN) (red) and EBOV antigens (green) showing a circulating EBOV-positive dendritic cell at day 3 (B) and large numbers of EBOV-positive dendritic cells (orange/gold) at day 5 (D). C: Double labeling for a macrophage marker (red) and EBOV antigens (green) demonstrating EBOV-positive macrophages (orange/gold) at day 5. E: Double labeling for a dendritic cell marker (DC-SIGN) (green) and EBOV antigens (red) demonstrating EBOV-positive dendritic cell (orange/gold) at day 4. Also, note EBOV-positive cell (red) with macrophage-like morphology and EBOV-negative dendritic cells (green) in this field. Inset: high-power view of the EBOV-positive dendritic cell in E by confocal microscopy. The nuclei were stained with DAPI (blue) in all panels. Original magnifications: ×40 (A and D); ×60 (B, C, E); ×300 (inset).
Figure 10.
Figure 10.
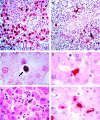
Localization of EBOV in cynomolgus monkey tissues. A: Immunopositive mononuclear cells (red) in the medullary sinus of a lymph node at day 3. The brown-pigmented cells are hemosiderin-laden macrophages. B: Immunopositive (red) dendritic cells surrounding a high endothelial venule in a lymph node at day 4. C: EBOV RNA-positive circulating monocyte (arrow) in hepatic sinusoid at day 2. D: Immunopositive (red) Kupffer cell at day 3. E: Histology of liver showing small foci of hepatocellular degeneration and necrosis and foci of pleomorphic eosinophilic intracytoplasmic inclusions (arrows) in hepatocytes at day 5. F: Immunopositive Kupffer cells (red) and hepatocytes (red) at day 5. Alkaline phosphatase method, A, B, D, F; H&E stain, E. Original magnifications: ×20 (A); ×40 (B); ×60 (C to F).
Figure 11.
Figure 11.
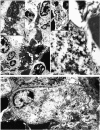
Ultrastructural appearance of dendritic cells in marginal zone of spleen of EBOV-Zaire-infected cynomolgus monkeys. A: EBOV-infected dendritic cell at day 4 with typical branching processes (arrowheads). Inset: Enlargement of area marked by arrow in A shows virions budding from plasma membrane. B: Immunoelectron microscopy showing positive gold sphere (10 nm) labeling of plasma membrane and cytoplasm of EBOV-infected dendritic cell for DC-SIGN at day 3. Note virions budding from plasma membrane (arrowhead) and near absence of gold spheres on adjacent red blood cell (*). Inset: Low-power view of EBOV-infected, DC-SIGN-positive pale-staining cell interpreted as an immature dendritic cell. C: EBOV-infected pale-staining cell interpreted as an immature dendritic cell at day 3. Morphology is comparable to DC-SIGN positive cell in inset of B. Note virions budding from plasma membrane (arrows), pale-staining cytoplasm, and sparsity of organelles. Original magnifications: ×6,500 (A and B, inset); ×12,500 (C); ×16,000 (A, inset); ×53,000 (B).
Figure 12.
Figure 12.
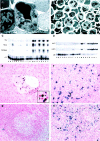
Analysis of PBMC from EBOV-Zaire-infected cynomolgus monkeys for evidence of apoptosis. A and B: Transmission electron micrographs of peripheral blood mononuclear cells. A: Apoptosis of a large lymphocyte (∼6 × 8 μm in cross-section) morphologically consistent with a NK cell at day 3. Arrowheads indicate cytoplasmic granules. Also, note abundance of mitochondria. B: Apoptotic small lymphocyte (arrow) and increased numbers of neutrophils at day 4. C and D: Analysis of PBMC mRNA; representative RNase protection assays are shown. C: Fas and TRAIL, Comparison of preinfection PBMC (lanes A, D, H, K, O, Q, S) with PBMC at postinfection day 1 (lanes B and E); day 2 (lanes F, I, L); day 3 (lanes C, G, J); day 4 (lane M); day 5 (lanes P and R); and day 6 (lanes N and T). D: NAIP and cIAP2. Comparison of preinfection PBMC (lanes A to C) with PBMC at postinfection day 1 (lanes D to F); day 2 (lanes G to I); day 3 (lanes J to L); day 4 (lanes M to O); day 5 (lanes P to R); and day 6 (lanes S and T). E to H: Analyses of tissues by TUNEL assay. E: Apoptotic mononuclear cells (black reaction product) within the lumen of a central hepatic vein and to the periphery of the vein at day 3. Arrow in the inset points to an unaffected neutrophil and the arrowhead indicates the apoptotic lymphocyte. At day 4, follicles in a lymph node contain macrophages and dendritiform cells that have engulfed tingible bodies (F). G: A follicular area in spleen of an uninfected control monkey, showing little evidence of apoptosis, compared to a similar area in spleen of an EBOV-infected monkey at day 5, showing macrophages that have engulfed tingle bodies; single-strand breaks appear blue/black in F to H. Original magnifications: ×20 (E to H); ×6,500 (B); ×16,000 (A).

Similar articles

Cited by

References

    1. Bowen ETW, Lloyd G, Harris WJ, Platt GS, Baskerville A, Vella EE: Viral haemorrhagic fever in southern Sudan and northern Zaire. Lancet 1977, 1:571-573 - PubMed
    1. Johnson KM, Lange JV, Webb PA, Murphy FA: Isolation and partial characterization of a new virus causing acute haemorrhagic fever in Zaire. Lancet 1977, 1:569-571 - PubMed
    1. Khan AS, Tshioko K, Heymann DL, Le Guenno B, Nabreth P, Kerstiens B, Fleerackers Y, Kilmarx PH, Rodier GR, Nkuku O, Rollin PE, Sanchez A, Zaki SR, Swanepoel R, Tomori O, Nichol ST, Peters CJ, Muyembe-Tamfum JJ, Ksiazek TG: The reemergence of Ebola hemorrhagic fever, Democratic Republic of the Congo, 1995. J Infect Dis 1999, 179(Suppl 1):S76-S86 - PubMed
    1. Bowen ETW, Platt GS, Simpson DIH, McArdell LB, Raymond RT: Ebola haemorrhagic fever: experimental infection of monkeys. Trans R Soc Trop Med Hyg 1978, 72:188-191 - PubMed
    1. Fisher-Hoch SP, Brammer LT, Trappier SG, Hutwagner LC, Farrar BB, Ruo SL, Brown BG, Hermann LM, Perez-Oronoz GI, Goldsmith CS, Hanes MA, McCormick JB: Pathogenic potential of filoviruses: role of geographic origin of primate host and virus strain. J Infect Dis 1992, 166:753-763 - PubMed

Publication types