Natural selection shaped regional mtDNA variation in humans
- PMID: 12509511
- PMCID: PMC140917
- DOI: 10.1073/pnas.0136972100
Natural selection shaped regional mtDNA variation in humans
Abstract
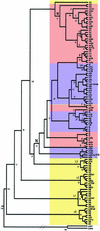
Human mtDNA shows striking regional variation, traditionally attributed to genetic drift. However, it is not easy to account for the fact that only two mtDNA lineages (M and N) left Africa to colonize Eurasia and that lineages A, C, D, and G show a 5-fold enrichment from central Asia to Siberia. As an alternative to drift, natural selection might have enriched for certain mtDNA lineages as people migrated north into colder climates. To test this hypothesis we analyzed 104 complete mtDNA sequences from all global regions and lineages. African mtDNA variation did not significantly deviate from the standard neutral model, but European, Asian, and Siberian plus Native American variations did. Analysis of amino acid substitution mutations (nonsynonymous, Ka) versus neutral mutations (synonymous, Ks) (kaks) for all 13 mtDNA protein-coding genes revealed that the ATP6 gene had the highest amino acid sequence variation of any human mtDNA gene, even though ATP6 is one of the more conserved mtDNA proteins. Comparison of the kaks ratios for each mtDNA gene from the tropical, temperate, and arctic zones revealed that ATP6 was highly variable in the mtDNAs from the arctic zone, cytochrome b was particularly variable in the temperate zone, and cytochrome oxidase I was notably more variable in the tropics. Moreover, multiple amino acid changes found in ATP6, cytochrome b, and cytochrome oxidase I appeared to be functionally significant. From these analyses we conclude that selection may have played a role in shaping human regional mtDNA variation and that one of the selective influences was climate.
Figures


Similar articles
-
Effects of purifying and adaptive selection on regional variation in human mtDNA.Science. 2004 Jan 9;303(5655):223-6. doi: 10.1126/science.1088434. Science. 2004. PMID: 14716012
-
Analysis of Canis mitochondrial DNA demonstrates high concordance between the control region and ATPase genes.BMC Evol Biol. 2010 Jul 16;10:215. doi: 10.1186/1471-2148-10-215. BMC Evol Biol. 2010. PMID: 20637067 Free PMC article.
-
Evaluating the role of selection in the evolution of mitochondrial genomes of aboriginal peoples of Siberia.Vavilovskii Zhurnal Genet Selektsii. 2023 Jun;27(3):218-223. doi: 10.18699/VJGB-23-28. Vavilovskii Zhurnal Genet Selektsii. 2023. PMID: 37293444 Free PMC article.
-
Catarrhine primate divergence dates estimated from complete mitochondrial genomes: concordance with fossil and nuclear DNA evidence.J Hum Evol. 2005 Mar;48(3):237-57. doi: 10.1016/j.jhevol.2004.11.007. Epub 2005 Jan 20. J Hum Evol. 2005. PMID: 15737392 Review.
-
The reversal of human phylogeny: Homo left Africa as erectus, came back as sapiens sapiens.Hereditas. 2020 Dec 19;157(1):51. doi: 10.1186/s41065-020-00163-9. Hereditas. 2020. PMID: 33341120 Free PMC article. Review.
Cited by
-
Association between mitochondrial DNA copy number and neurodevelopmental outcomes among black and white preterm infants up to two years of age.Interdiscip Nurs Res. 2024 Oct 1;3(3):149-156. doi: 10.1097/NR9.0000000000000071. eCollection 2024 Sep. Interdiscip Nurs Res. 2024. PMID: 39554223 Free PMC article.
-
Mitogenomics clarifies the position of the Nearctic magpies (Pica hudsonia and Pica nuttalli) within the Holarctic magpie radiation.Curr Zool. 2023 Nov 1;70(5):618-630. doi: 10.1093/cz/zoad048. eCollection 2024 Oct. Curr Zool. 2023. PMID: 39463698 Free PMC article.
-
Paleopteran molecular clock: Time drift and recent acceleration.Ecol Evol. 2024 Sep 18;14(9):e70297. doi: 10.1002/ece3.70297. eCollection 2024 Sep. Ecol Evol. 2024. PMID: 39301292 Free PMC article.
-
Mitochondrial Health Markers and Obesity-Related Health in Human Population Studies: A Narrative Review of Recent Literature.Curr Obes Rep. 2024 Dec;13(4):724-738. doi: 10.1007/s13679-024-00588-7. Epub 2024 Sep 17. Curr Obes Rep. 2024. PMID: 39287712 Review.
-
Mitochondrial DNA of the Arabian Camel Camelus dromedarius.Animals (Basel). 2024 Aug 24;14(17):2460. doi: 10.3390/ani14172460. Animals (Basel). 2024. PMID: 39272245 Free PMC article. Review.
References
-
- Wallace D C, Brown M D, Lott M T. Gene. 1999;238:211–230. - PubMed
-
- Quintana-Murci L, Semino O, Bandelt H J, Passarino G, McElreavey K, Santachiara-Benerecetti A S. Nat Genet. 1999;23:437–441. - PubMed
-
- Schurr T G, Wallace D C. Hum Biol. 2002;74:431–452. - PubMed
-
- Torroni A, Miller J A, Moore L G, Zamudio S, Zhuang J, Droma R, Wallace D C. Am J Phys Anthropol. 1994;93:189–199. - PubMed
-
- Schurr T G, Sukernik R I, Starikovskaya Y B, Wallace D C. Am J Phys Anthropol. 1999;108:1–39. - PubMed
Publication types
MeSH terms
Substances
Associated data
- Actions
- Actions
- Actions
- Actions
- Actions
- Actions
- Actions
- Actions
- Actions
- Actions
- Actions
- Actions
- Actions
- Actions
- Actions
- Actions
- Actions
- Actions
- Actions
- Actions
- Actions
- Actions
- Actions
- Actions
- Actions
- Actions
- Actions
- Actions
- Actions
- Actions
- Actions
- Actions
- Actions
- Actions
- Actions
- Actions
- Actions
- Actions
- Actions
- Actions
- Actions
- Actions
- Actions
- Actions
- Actions
- Actions
- Actions
- Actions
Grants and funding
LinkOut - more resources
Full Text Sources
Other Literature Sources
Molecular Biology Databases
Research Materials


