iBet uBet web content aggregator. Adding the entire web to your favor.


Link to original content: https://pubmed.ncbi.nlm.nih.gov/12015417/
Molecular determinants of the inhibition of human Kv1.5 potassium currents by external protons and Zn(2+) - PubMed Skip to main page content
U.S. flag

An official website of the United States government

Dot gov

The .gov means it’s official.
Federal government websites often end in .gov or .mil. Before sharing sensitive information, make sure you’re on a federal government site.

Https

The site is secure.
The https:// ensures that you are connecting to the official website and that any information you provide is encrypted and transmitted securely.

Access keys NCBI Homepage MyNCBI Homepage Main Content Main Navigation
. 2002 May 15;541(Pt 1):9-24.
doi: 10.1113/jphysiol.2001.014456.

Molecular determinants of the inhibition of human Kv1.5 potassium currents by external protons and Zn(2+)

Affiliations

Molecular determinants of the inhibition of human Kv1.5 potassium currents by external protons and Zn(2+)

Steven J Kehl et al. J Physiol. .

Abstract

Using human Kv1.5 channels expressed in HEK293 cells we assessed the ability of H+o to mimic the previously reported action of Zn(2+) to inhibit macroscopic hKv1.5 currents, and using site-directed mutagenesis, we addressed the mechanistic basis for the inhibitory effects of H(+)(o) and Zn(2+). As with Zn(2+), H(+)(o) caused a concentration-dependent, K(+)(o)-sensitive and reversible reduction of the maximum conductance (g(max)). With zero, 5 and 140 mM K(+)(o) the pK(H) for this decrease of g(max) was 6.8, 6.2 and 6.0, respectively. The concentration dependence of the block relief caused by increasing [K(+)](o) was well fitted by a non-competitive interaction between H(+)(o) and K(+)(o), for which the K(D) for the K(+) binding site was 0.5-1.0 mM. Additionally, gating current analysis in the non-conducting mutant hKv1.5 W472F showed that changing from pH 7.4 to pH 5.4 did not affect Q(max) and that charge immobilization, presumed to be due to C-type inactivation, was preserved at pH 5.4. Inhibition of hKv1.5 currents by H+o or Zn(2+) was substantially reduced by a mutation either in the channel turret (H463Q) or near the pore mouth (R487V). In light of the requirement for R487, the homologue of Shaker T449, as well as the block-relieving action of K(+)(o), we propose that H(+) or Zn(2+) binding to histidine residues in the pore turret stabilizes a channel conformation that is most likely an inactivated state.


Figures
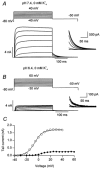
Figure 1
Figure 1. Extracellular acidification decreases the maximum conductance (gmax) and causes a rightward shift of the conductance-voltage (g(V)) relationship for hKv1.5 currents
Panels A and B show, respectively, representative control (pH 7.4) and treated (pH 6.4) currents evoked by the voltage protocol shown above each family of traces. Successive pulse command voltages were incremented by 5 mV but for clarity only alternate traces are shown. The change of the range of pulse voltages at pH 6.4 was necessary to compensate for the gating shift. The holding potential in this and other figures was −80 mV, except where noted. Inset traces show the tail currents at a higher gain. Tail current amplitudes, obtained by extrapolating the fit of a single exponential function to the start of the step to −50 mV, are plotted in C and fitted to a Boltzmann function to obtain the equivalent of the g(V) relationship. Acidification shifted the V1/2 from −6.2 mV to 4.3 mV and the maximum current decreased from 1.7 nA to 0.24 nA, which corresponds to a gmax relative to that at pH 7.4 (relative gmax) of 0.14.
Figure 9
Figure 9. The effect of the stimulus frequency and holding potential on the inhibition of wild-type hKv1.5 currents by Ho+
This graph, which is representative of the results obtained from six such experiments, three at pH 5.9 and three with 1 mm Zn2+, plots the amplitude of tail currents measured at −50 mV following a 300 ms step to 60 mV to maximally activate channels. After 10 consecutive control responses in standard external saline (pH 7.4, 3.5 mm Ko+) and evoked at 5 s intervals from a holding potential of −80 mV, pulsing was stopped and 5 ml of test solution was perfused to change the extracellular pH to 5.9 for the duration indicated by arrows. Resumption of the step commands approximately 2 min after extracellular acidification showed an immediate ≈75 % reduction of the tail current amplitude. The identical effect was obtained for each of two subsequent pulse trains confirming that the inhibition was not affected by a period without stimulation. Changing the holding potential to −100 mV also had no effect on the current amplitude. Returning to pH 7.4 medium while pulsing shows the effect rapidly (within 15 s) and completely reverses, implying that a change of the internal pH is not involved.
Figure 2
Figure 2. Increasing Ko+ reduces the inhibition of hKv1.5 current by protons
Traces obtained from three different cells showing the current at pH 7.4 (control, top row) and pH 6.4 (treated, lower row) in, from left to right, zero, 3.5 and 140 mm Ko+. In zero Ko+, control and treated pulse currents were evoked by 300 ms pulses from −50 to 45 mV in 5 mV steps; in 3.5 mm Ko+, the pulse command range was −50 to 45 mV at pH 7.4 and −30 to 65 mV at pH 6.4; in 140 mm Ko+, the range for pulse voltages was −40 to 55 mV. For clarity, only alternate current traces are shown. The corresponding control (○) and treated g(V) relationships, obtained from a number of similar experiments, are shown in the graph at the bottom of each column. Treated data were normalized with respect both to the gmax at pH 6.4 (▪) and to the control gmax (•). The relative gmax at pH 6.4 in zero, 3.5 and 140 mm Ko+ was 0.19 ± 0.02 (n = 12), 0.56 ± 0.01 (n = 6), and 0.81 ± 0.12 (n = 6), respectively. In zero Ko+, V1/2 and s changed from −21.4 ± 4.3 and 4.7 ± 0.5 mV at pH 7.4 to −8.2 ± 4.0 and 7.1 ± 0.3 mV at pH 6.4, respectively. In 3.5 mm Ko+, the corresponding values were −18.3 ± 1.9 mV and 3.9 ± 0.4 mV at pH 7.4 and −10.5 ± 1.2 mV and 3.9 ± 0.4 mV at pH 6.4; and, in 140 mm Ko+, −26.2 ± 1.1 mV and 3.8 ± 0.3 mV at pH 7.4 and −12.3 ± 1.1 mV and 3.8 ± 0.4 mV at pH 6.4.
Figure 3
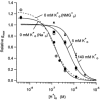
Figure 3. The concentration dependence of the inhibition of Kv1.5 currents by protons in zero (•), 5 (▪) and 140 mm (▴) Ko+
Data for zero Ko+ were obtained with either 143.5 mm Na+ (•) or 143.5 mm NMG+ (○) as the major extracellular cation. The lines represent the best fit to eqn (3). The fitted values for the equilibrium dissociation constant for protons (KH), the pKH and nH were, in zero Ko+ and 143.5 mm NMG+: 128 ± 53 nm (mean ± s.d.), 6.9 and 1.2 ± 0.5; in zero Ko+ and 143.5 mm Na+: 153 ± 13 nm, 6.8 and 1.5 ± 0.2; in 5 mm Ko+: 590 ± 85 nm, 6.2 and 1.6 ± 0.4; and in 140 mm Ko+: 1.1 ± 0.11 μM, 6.0 and 1.8 ± 0.3. Although the pKH estimates with either Na+ or NMG+ as the extracellular cation are similar, the increase of the relative gmax with NMG+ at pH 8.4 was significantly greater. Consistent with a non-competitive versus competitive interaction between Ho+ and Ko+ (see Fig. 4), the increase of KH going from zero to 5 mm Ko+ was greater than that going from 5 mm to 140 mm.
Figure 4
Figure 4. The concentration dependence of the antagonism by Ko+ and Cso+ of the inhibition of hKv1.5 currents by Ho+
The relative gmax at different Ko+ concentrations is plotted for pH 6.9 (▪), pH 6.4 (▴) and pH 5.9 (•). The data for pH 6.9 and 5.4 were obtained with zero, 5, 20 and 140 mm Ko+. At pH 6.4, Ko+ was zero, 1, 3.5, 5, 10, 20, 80 and 140 mm. Assessment of the block-relieving effect of Cso+ (▿) was done with concentrations of 3.5, 20 and 140 mm. The lines represent the best fit of the data to eqn (4) (see Methods). With the values for KH and nH fixed to those obtained directly from the data in Fig. 3 (153 nm and 1.5, respectively) the best-fit values for KK and α were 0.65 ± 0.27 mm and 5.5 ± 0.7. Cso+ appears to be equivalent to Ko+ in its antagonism of the proton block. The best fit of the data at pH 6.9 was obtained with 0.93 ± 2.8 mm for KK and 6.2 ± 9.1 for α; at pH 5.9 the corresponding values were 0.66 ± 0.48 mm and 6.2 ± 1. These estimates for KK are very near those estimated for the Ko+ relief of the Zn2+ block (≈0.5 mm; Zhang et al. 2001b).
Figure 5
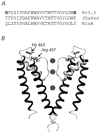
Figure 5. The structure of the S5, S6 and the pore (P) loop of Kv1.5 inferred from the crystal structure of KcsA
A, the sequence alignment for Kv1.5, Shaker and KcsA between the turret and the outer pore mouth. B, a side view of the KcsA channel in which the foreground and background α-subunits have been removed for clarity. The α-subunit of voltage-gated K+ channels has an additional four transmembrane segments (S1-S4) that are not illustrated. Sites at which mutations were made, namely H463 and R487, are shown at their homologous positions in the KcsA crystal structure. The orientation of the side chains of these two residues is tentative.
Figure 6
Figure 6. A point mutation in the turret (S5-P loop), H463Q, reduces the inhibition but not the gating shift caused by Ho+ and Zn2+
A, the g(V) relationship in zero Ko+ at pH 8.4 (♦), pH 7.4 (○), pH 6.4 (▪), pH 5.9 (▴) and pH 5.5 (▾) after normalization with respect to the gmax at pH 7.4. Values for the relative gmax, V1/2 and s were: at pH 8.4, 1.1 ± 0.02, −23.9 ± 1.3 mV and 5.4 ± 0.5 mV (n = 5); at pH 7.4, 1, −20.1 ± 1.0 mV and 4.6 ± 0.2 mV(n = 28); at pH 6.4, 1.06 ± 0.03, −13.0 ± 0.5 mV and 4.0 ± 0.5 mV (n = 3); at pH 5.9, 0.86 ± 0.08, 7.6 ± 0.7 mV and 5.6 ± 0.4 mV (n = 8); and, at pH 5.5, 0.63 ± 0.04, 19.2 ± 1.7 mV and 5.7 ± 0.4 mV (n = 7). B, the concentration dependence of the reduction of gmax by protons. Fitting of the data to the Hill equation gave a KD of 4.7 ± 1.9 μM (pKH ≈ 5.3) and nH of 1.0 ± 0.4. The gmax-Ho+ concentration relationship for wild-type hKv1.5 is represented by the dashed line. C, the g(V) relationship as described for A but with zero (○), 50 μM (□), 200 μM(▾), 1 mm (▪) and 2.5 mm (▴) of Zn2+. The relative gmax, V1/2, and s were 1, −14.9 ± 0.9 mV and 4.8 ± 0.3 mV for the control (n = 27); 0.87 ± 0.08, −1.9 ± 0.9 mV and 6.2 ± 0.9 mV for 50 μM Zn2+ (n = 5); 0.77 ± 0.09, 7.1 ± 1.1 mV and 5.9 ± 0.2 mV for 200 μM Zn2+ (n = 6); 0.47 ± 0.04, 18.5 ± 2.0 mV and 6.0 ± 0.7 mV for 1 mm Zn2+ (n = 10); and 0.52 ± 0.009, 27.2 ± 2.3 mV and 6.4 ± 0.8 mV for 2.5 mm Zn2+ (n = 5). D, as described for B but with Zn2+. The best-fit values for KZn and nH were 1.7 ± 1 mm and 0.5 ± 0.2. The dashed line indicates the concentration-response relationship for wild-type Kv1.5 in zero Ko+ (KZn = 69 μM, nH = 0.9; Zhang et al. 2001b).
Figure 7
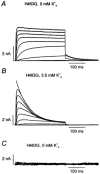
Figure 7. In hKv1.5 H463G slow inactivation is greatly accelerated and the conductance collapses in zero Ko+ at pH 7.4
A, shown for comparison are the currents from hKv1.5 H463Q evoked in zero Ko+ by 300 ms pulses to between −40 and 40 mV in 10 mV increments. B, hKv1.5 H463G currents recorded using the same stimulus protocol but with 3.5 mm Ko+. The solid line superimposed on the current at 40 mV represents the best fit of the current decay to a single exponential function. The mean time constant for inactivation at 40 mV was 73 ± 8 ms (n = 4). C, from the same cell as in B and using the same voltage command protocol after switching to zero Ko+ at pH 7.4. Unlike either wild-type Kv1.5 H463 (Fig. 1) or Kv1.5 H463Q, Ko+ is required for hKv1.5 H463G channels to function normally at pH 7.4. Complete recovery was obtained after returning to K+-containing bath solution (not shown).
Figure 8
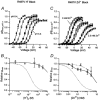
Figure 8. A mutation near the pore mouth, R487V, substantially reduces the sensitivity to inhibition by Ho+ and Zn2+
A, the g(V) relationship in zero Ko+ at pH 8.4 (♦), pH 7.4 (○), pH 6.4 (▪), pH 5.9 (▴) and pH 5.5 (▾) after normalization with respect to gmax at pH 7.4. The values for the relative gmax, V1/2 and s were, respectively, 1.04 ± 0.02, −28.5 ± 1.1 mV, 4.6 ± 1.0 mV at pH 8.4 (n = 3); 1, −18.1 ± 0.9 mV, 4.5 ± 0.2 mV at pH 7.4 (n = 17); 1.04 ± 0.06, −1.8 ± 1.3 mV, 5.6 ± 0.4 mV at pH 6.4 (n = 5); 0.92 ± 0.03, 6.4 ± 1.3, 4.9 ± 0.4 at pH 5.9; and 0.87 ± 0.03, 15.5 ± 1.6 mV, 5.5 ± 0.2 mV at pH 5.5 (n = 5). B, the concentration-response relationship for the reduction of gmax by protons. The continuous line, representing the best fit of the data to the Hill equation, was obtained with KH = 23 μM (pKH of 4.6) and nH = 0.8. C, the g(V) relationship in zero Ko+ and with Zn2+ concentrations of 10 μM (•), 25 μM (♦), 100 μM (⋄), 200 μM (▾), 1 mm (▪) and 2.5 mm (▴) after normalization with respect to the control (○) gmax. The relative gmax, V1/2 and s were, respectively, 1, −13.4 ± 1.5 mV, 4.5 ± 0.3 mV for the control (n = 15), 0.99 ± 0.01, −5.9 ± 1.5 mV, 5.4 ± 0.4 mV in 10 μM Zn2+ (n = 4); 0.92 ± 0.05, −5.7 ± 0.1 mV, 4.7 ± 0.5 mV in 25 μM Zn2+ (n = 3); 0.80 ± 0.02, 2.8 ± 1.8 mV, 4.8 ± 0.5 mV in 100 μM Zn2+ (n = 4); 0.78 ± 0.02, 5.2 ± 1.6 mV, 5.3 ± 0.3 mV in 200 μM Zn2+ (n = 5); 0.70 ± 0.05, 21.0 ± 1.2 mV, 5.9 ± 0.3 mV in 1 mm Zn2+ (n = 3); and 0.59 ± 0.02, 28.9 ± 1.1 mV, 5.9 ± 0.3 mV in 2.5 mm Zn2+ (n = 5). D, as described for B but with Zn2+. The continuous line represents the best fit of the hKv1.5 R487V data to the sum of two Hill equations. Binding at the higher affinity site (KZn = 29 ± 0.2 μM) accounted for ≈20 % of the inhibition. The apparent elimination of the higher affinity site in the double mutant Kv1.5 R487V, H463Q (▵ and dashed line) suggests that it may reflect Zn2+ binding to H463. The extrapolated KZn for the lower affinity site in the R487V mutant was 6.4 ± 0.07 mm. Again, the dotted lines in B and D represent the corresponding concentration-response curves for wild-type hKv1.5 (Zhang et al. 2001b).
Figure 10
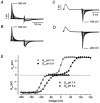
Figure 10. Extracellular acidification to pH 5.4 causes a depolarizing shift of the Qon(V) and Qoff(V) relationships but does not reduce Qmax
Panels A and B show at pH 7.4 and 5.4, respectively, the on- and off-gating currents recorded when the membrane was depolarized for 12 ms from a holding potential of −100 mV to between −60 and 100 mV (A) or −60 and 150 mV (B) in 10 mV increments before stepping back to −100 mV. Outward charge movement (Qon) induced by the depolarization was determined by integrating the on-gating currents at pH 7.4 (○) and 5.4 (•), and is plotted in panel E. For the Qon(V) relationship in E, the fitted values for V1/2 and s were, respectively, −2.2 mV and 6.5 mV at pH 7.4 and 50.2 mV and 11.8 mV at pH 5.4. Qmax was not significantly affected by extracellular acidification. C and D, from the same cell as in A and B, these panels show the off-gating currents following a 12 ms step from −80 mV to 50 mV in pH 7.4 (C) or to 100 mV at pH 5.4 (D) to move Qmax. Off-gating current was recorded in 10 mV increments between −200 and −10 mV at pH 7.4 and between −200 and 40 mV at pH 5.4. Charge return at pH 7.4 (▵) and pH 5.4 (▴) is plotted against the repolarization voltage in E to obtain the Qoff(V) relationship. Extracellular acidification changed the V1/2 of Qoff(V) from −100.5 mV to −72.9 mV and s increased from 9.4 mV to 13.1 mV. Both at pH 7.4 and pH 5.4 there is a leftward shift of the voltage dependence of Qoff relative to Qon(V).

Similar articles

Cited by

References

    1. Aiyar J, Withka JM, Rizzi JP, Singleton DH, Andrews GC, Lin W, Boyd J, Hanson DC, Simon M, Dethlefs B. Topology of the pore-region of a K+ channel revealed by the NMR-derived structures of scorpion toxins. Neuron. 1995;15:1169–1181. - PubMed
    1. Backx PH, Yue DT, Lawrence JH, Marban E, Tomaselli GF. Molecular localization of an ion-binding site within the pore of mammalian sodium channels. Science. 1992;257:248–251. - PubMed
    1. Baukrowitz T, Yellen G. Modulation of K+ current by frequency and external [K+]: A tale of two inactivation mechanisms. Neuron. 1995;15:951–960. - PubMed
    1. Baukrowitz T, Yellen G. Two functionally distinct subsites for the binding of internal blockers to the pore of voltage-activated K+ channels. Proceedings of the National Academy of Sciences of the USA. 1996;93:13 357–13 361. - PMC - PubMed
    1. Blaustein RO, Cole PA, Williams C, Miller C. Tethered blockers as molecular ‘tape measures’ for a voltage-gated K+ channel. Nature Structural Biology. 2000;7:309–311. - PubMed

Publication types

MeSH terms

LinkOut - more resources