A back migration from Asia to sub-Saharan Africa is supported by high-resolution analysis of human Y-chromosome haplotypes
- PMID: 11910562
- PMCID: PMC447595
- DOI: 10.1086/340257
A back migration from Asia to sub-Saharan Africa is supported by high-resolution analysis of human Y-chromosome haplotypes
Abstract
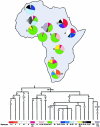
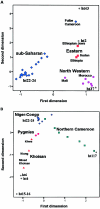
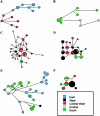
The variation of 77 biallelic sites located in the nonrecombining portion of the Y chromosome was examined in 608 male subjects from 22 African populations. This survey revealed a total of 37 binary haplotypes, which were combined with microsatellite polymorphism data to evaluate internal diversities and to estimate coalescence ages of the binary haplotypes. The majority of binary haplotypes showed a nonuniform distribution across the continent. Analysis of molecular variance detected a high level of interpopulation diversity (PhiST=0.342), which appears to be partially related to the geography (PhiCT=0.230). In sub-Saharan Africa, the recent spread of a set of haplotypes partially erased pre-existing diversity, but a high level of population (PhiST=0.332) and geographic (PhiCT=0.179) structuring persists. Correspondence analysis shows that three main clusters of populations can be identified: northern, eastern, and sub-Saharan Africans. Among the latter, the Khoisan, the Pygmies, and the northern Cameroonians are clearly distinct from a tight cluster formed by the Niger-Congo-speaking populations from western, central western, and southern Africa. Phylogeographic analyses suggest that a large component of the present Khoisan gene pool is eastern African in origin and that Asia was the source of a back migration to sub-Saharan Africa. Haplogroup IX Y chromosomes appear to have been involved in such a migration, the traces of which can now be observed mostly in northern Cameroon.
Figures


Similar articles
-
Combined use of biallelic and microsatellite Y-chromosome polymorphisms to infer affinities among African populations.Am J Hum Genet. 1999 Sep;65(3):829-46. doi: 10.1086/302538. Am J Hum Genet. 1999. PMID: 10441590 Free PMC article.
-
High-resolution analysis of human Y-chromosome variation shows a sharp discontinuity and limited gene flow between northwestern Africa and the Iberian Peninsula.Am J Hum Genet. 2001 Apr;68(4):1019-29. doi: 10.1086/319521. Epub 2001 Mar 14. Am J Hum Genet. 2001. PMID: 11254456 Free PMC article.
-
Y-chromosomal variation in sub-Saharan Africa: insights into the history of Niger-Congo groups.Mol Biol Evol. 2011 Mar;28(3):1255-69. doi: 10.1093/molbev/msq312. Epub 2010 Nov 25. Mol Biol Evol. 2011. PMID: 21109585 Free PMC article.
-
Heterogeneity of the Y chromosome in Afro-Brazilian populations.Hum Biol. 2004 Feb;76(1):77-86. doi: 10.1353/hub.2004.0014. Hum Biol. 2004. PMID: 15222681 Review.
-
African genetic diversity provides novel insights into evolutionary history and local adaptations.Hum Mol Genet. 2018 Aug 1;27(R2):R209-R218. doi: 10.1093/hmg/ddy161. Hum Mol Genet. 2018. PMID: 29741686 Free PMC article. Review.
Cited by
-
Origins of East Caucasus Gene Pool: Contributions of Autochthonous Bronze Age Populations and Migrations from West Asia Estimated from Y-Chromosome Data.Genes (Basel). 2023 Sep 9;14(9):1780. doi: 10.3390/genes14091780. Genes (Basel). 2023. PMID: 37761920 Free PMC article.
-
The ancestry and geographical origins of St Helena's liberated Africans.Am J Hum Genet. 2023 Sep 7;110(9):1590-1599. doi: 10.1016/j.ajhg.2023.08.001. Am J Hum Genet. 2023. PMID: 37683613 Free PMC article.
-
The COVID-19 Pandemic and Explaining Outcomes in Africa: Could Genomic Variation Add to the Debate?OMICS. 2022 Nov;26(11):594-607. doi: 10.1089/omi.2022.0108. Epub 2022 Nov 2. OMICS. 2022. PMID: 36322905 Free PMC article. Review.
-
Uniparental markers reveal new insights on subcontinental ancestry and sex-biased admixture in Brazil.Mol Genet Genomics. 2022 Mar;297(2):419-435. doi: 10.1007/s00438-022-01857-7. Epub 2022 Jan 21. Mol Genet Genomics. 2022. PMID: 35061071
-
Social stratification without genetic differentiation at the site of Kulubnarti in Christian Period Nubia.Nat Commun. 2021 Dec 14;12(1):7283. doi: 10.1038/s41467-021-27356-8. Nat Commun. 2021. PMID: 34907168 Free PMC article.
References
Electronic-Database Information
-
- Arlequin's Home on the Web, http://anthro.unige.ch/arlequin/ (for Arlequin version 2.000 software)
-
- GenBank, http://www.ncbi.nlm.nih.gov/Genbank/ (for cosmid cAMF3.1 [accession number X96421.1])
-
- Laboratory of Molecular Anthropology, http://www.scienzemfn.uniroma1.it/labantro/index.html
-
- Life Sciences and Engineering Technology Solutions, http://www.fluxus-engineering.com/ (for Network version 2e software)
References
-
- Avise JC, Arnold J, Ball RM, Bermingham E, Lamb T, Neigel JE, Reeb CA, Saunders NC (1987) Intraspecific phylogeography: the mitochondrial DNA bridge between population genetics and systematics. Annu Rev Ecol Syst 18:489–522
-
- Bandelt H-J, Forster P, Röhl A (1999) Median-joining networks for inferring intraspecific phylogenies. Mol Biol Evol 16:37–48 - PubMed
Publication types
MeSH terms
Grants and funding
LinkOut - more resources
Full Text Sources


