iBet uBet web content aggregator. Adding the entire web to your favor.


Link to original content: https://pubmed.ncbi.nlm.nih.gov/10673546
Calcium-, voltage- and osmotic stress-sensitive currents in Xenopus oocytes and their relationship to single mechanically gated channels - PubMed Skip to main page content
U.S. flag

An official website of the United States government

Dot gov

The .gov means it’s official.
Federal government websites often end in .gov or .mil. Before sharing sensitive information, make sure you’re on a federal government site.

Https

The site is secure.
The https:// ensures that you are connecting to the official website and that any information you provide is encrypted and transmitted securely.

Access keys NCBI Homepage MyNCBI Homepage Main Content Main Navigation
. 2000 Feb 15;523 Pt 1(Pt 1):83-99.
doi: 10.1111/j.1469-7793.2000.t01-2-00083.x.

Calcium-, voltage- and osmotic stress-sensitive currents in Xenopus oocytes and their relationship to single mechanically gated channels

Affiliations

Calcium-, voltage- and osmotic stress-sensitive currents in Xenopus oocytes and their relationship to single mechanically gated channels

Y Zhang et al. J Physiol. .

Abstract

1. Patch recordings from Xenopus oocytes indicated that mechanically gated (MG) channels are expressed at a uniform surface density ( approximately 1 channel microm-2) with an estimated > 3 x 10⁶ MG channels per oocyte that could generate microamps of current at +/-50 mV. 2. Removal of external Ca2+ induced a membrane conductance that differed from MG channels in ion selectivity, pharmacology and sensitivity to connexion-38. 3. Depolarization to +50 mV activated a Na+-selective, a Cl--selective and a non-selective conductance. Hyperpolarization to -150 mV activated a non-selective conductance. None of these conductances appeared to be mediated by MG channels. 4. Hypotonicity (25 %) failed to evoke any change in membrane conductance in the majority of defolliculated oocytes. Hypertonicity (200 %) evoked a large non-selective (PK /PCl approximately 1) membrane conductance that was not blocked by 100 microM Gd3+. 5. Although the above stimuli could activate a variety of whole-oocyte conductances, including three novel conductances, they did not involve MG channel activation. Possible mechanisms underlying the discrepancy between observed conductances and those anticipated from patch-clamp studies are discussed.


Figures

Figure 1
Figure 1. MG channel activity in cell-attached patches on vegetal and animal hemispheres
Recordings of MG channel activity measured in different patches from the animal and vegetal hemispheres of the same oocyte. The upper trace shows the suction step (-25 mmHg) applied to both patches. The recordings were made with the different pulled halves (pipette tip diameter = ≈ 2 μm) of a single pipette capillary tube. The membrane potential was −100 mV and the pipette solution contained (mm): 100 KCl, 10 Hepes-KOH, 2 EGTA-KOH.
Figure 2
Figure 2. Ic and MG channel currents and reversal potential as functions of voltage and extracellular KCl activity, respectively
A, Ic current recordings of a voltage-clamped oocyte in response to voltage pulses. B, MG channel currents in a cell-attached patch elicited in response to repetitive suction pulses at different membrane potentials. C, Ic reversal potential as a function of extracellular KCl activity (10 oocytes, 2 frogs). D, MG channel reversal potential as a function of KCl activity (10 inside-out patches). Points are means of measured reversal potentials. Some s.e.m. bars are concealed by the data points. The continuous lines were calculated according to the Goldman-Hodgkin-Katz (GHK) equation, with the relative permeabilities obtained by curve fitting (PCl/PK = 0.24 and PCl/PK < 0.01, for Ic and MG channel, respectively). The dotted lines were calculated according to the GHK equation, assuming an ideally cation-selective conductance.
Figure 4
Figure 4. Comparison of the effects of flufenamic acid (FFA) and niflumic acid (NFA) on Ic and MG channels
A and B, dose-inhibition curves for the block of Ic by FFA and NFA measured in Ca2+-free Ringer solution. Data points show percentage inhibition. The continuous lines are best fits to the data. C, comparison of the maximal MG channel currents (Imax) in response to pressure pulses in cell-attached membrane patches with standard pipette solution (100 mm KCl, 5 mm Hepes-KOH) with and without 100 μM FFA. D, single MG channel I–V relations measured in standard pipette solution with and without 200 μM FFA or 200 μM NFA present.
Figure 3
Figure 3. The effect of extracellular acetate on Ic and MG channels
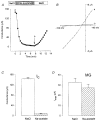
A shows the time course of Ic conductance block and recovery from block after switching from NaCl to sodium acetate and back. B shows the I–V relations before (a, dashed line) and after (b, continuous line) perfusion with acetate solution. C, histogram showing Ic conductance measured in NaCl and sodium acetate (data from 4 oocytes). D, histogram showing the maximal MG channel currents in cell-attached patches with NaCl (□) or sodium acetate (formula image) in the bath and pipette solutions (data from 6 patches in each condition using paired pipettes from single pulls). NaCl solution (mm): 120 NaCl, 5 Hepes-NaOH (pH 7.2). Sodium acetate solution (mm): 120 sodium acetate, pH adjusted with free Hepes to 7.2.
Figure 7
Figure 7. Depolarization-activated currents and I–V relations in different bathing solutions
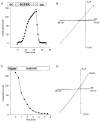
A, membrane potential and current recordings when 100 mm K+ in Ringer solution was replaced by 100 mm Na+ (NR). Top trace is the voltage protocol (depolarization pulse from −30 mV to +50 mV for 100 s). Voltage ramps of 1.5 s were applied before (a) and during (b and c) the 120 s depolarizing pulse. Bottom trace is current recording. B, I–V relations measured by the second (ba; dashed line) and the third (ca; continuous line) ramps after subtraction of the current of the first ramp (a). C, I–V relations of the depolarization-activated currents in 120 mm potassium acetate and 120 mm sodium acetate solution. D, I–V relations of depolarization-activated currents in 120 mm KCl, 120 mm potassium acetate solution and their difference current (KCl – potassium acetate). Each solution had a pH of 7.5, adjusted with Hepes.
Figure 5
Figure 5. Three types of depolarization-activated current waveforms recorded in different oocytes
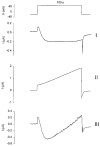
The upper panel shows a depolarizing pulse of 100 s. The holding potential was stepped from −20 mV to +50 mV and then stepped back to −20 mV. I, II and III are the three types of current waveforms that are seen in different oocytes (67 oocytes, 3 frogs) recorded in NR.
Figure 6
Figure 6. Current-voltage relations of the three currents (I, II and III) similar to those shown in Fig. 5
The upper panel of each figure is the voltage protocol. The holding potential was stepped from −20 mV to +50 mV for 100 s and then stepped back to −20 mV. Voltage ramps were applied before and within each depolarizing pulse. Each recording was obtained from a different oocyte in NR. The middle panels show the currents and the lower panels show the I–V relations of the 2nd (ba, continuous lines) and 3rd (ca, dashed lines) voltage ramps minus the I–V curves of the 1st ramps (a).
Figure 8
Figure 8. Activation of the residual conductance by depolarization in potassium acetate solution and the effects of Cs+ and FFA
A, recordings of the membrane potential and current of an oocyte in potassium acetate solution. The depolarization pulse was 120 s. B, I–V relations of Ir with the resting conductance subtracted. C, I–V relations of Ir in potassium acetate and caesium acetate. Potassium acetate solution (mm): 120 potassium acetate, 2 Hepes-KOH, 2 calcium acetate (pH 7.2). Caesium acetate solution (mm): 120 caesium acetate, 2 calcium acetate (pH 7.2, adjusted by adding Hepes directly to the solutions). D, I–V relations of Ir in potassium acetate solution in the absence and presence of 100 μM FFA.
Figure 9
Figure 9. Hyperpolarization-induced current and its ion selectivity
A shows the typical current induced by a hyperpolarization of −150 mV for 3 min. B shows the current responses to shorter (5 s) hyperpolarization pulses. The oocytes were held at −30 mV before the hyperpolarizing pulses were applied. C, I–V relations of Ih in 120 mm sodium glutamate and 30 mm sodium glutamate. D, I–V relations of Ih in 120 mm TBA-Cl and 30 mm TBA-Cl. I–V relations were measured by voltage ramps. All solutions contained 1 mm CaCl2 and pH was adjusted to 7.2 with free Hepes. Mannitol (180 mm) was added to the 30 mm sodium glutamate and 30 mm TBA-Cl solutions to maintain osmolarity.
Figure 10
Figure 10. Gd3+ does not block Ih
A, 100 μM Gd3+ did not block Ih after its full activation. A 3 min hyperpolarizing pulse from −30 to −150 mV was applied along with six voltage ramps to measure the I–V relations. The lower panel shows the current responses. B, I–V relations of Ih in the absence (a, 3rd ramp) and presence (b, 6th ramp) of 100 μM Gd3+ in NR. The increased amplitude in Gd3+ reflects the time-dependent development of Ih that is apparently unaffected by 100 μM Gd3+.
Figure 11
Figure 11. Hypotonicity-induced conductance and its I–V relation
A and B, membrane conductance induced by hypotonicity (63 mosmol l−1, 25 %) in two different oocytes, with A illustrating the lack of response shown by most oocytes and B the response seen in 2 out of 38 oocytes. C and D, I–V relations measured by voltage ramps before, at the peak, and at the end of the conductance induction in A and B. The continuous lines are I–V relations measured at the peak of the conductance. The dashed lines are I–V relations measured before and after exposure to hypotonic solution.
Figure 12
Figure 12. Hypertonicity-induced conductance
A, a reversible conductance increase induced by hypertonic (480 mosmol l−1, 200 %) solution for a typical oocyte response. B, I–V relations measured by voltage ramps before, at the peak, and at the end of the conductance increase induced in A. Dashed line is the I–V relation measured at the peak of the conductance (b) and the continuous lines (a,c) are the I–V relations measured before exposure to hypertonic solution and after returning to isotonic solution. C, conductance of a pre-shrunk oocyte that was deactivated by returning to isotonic solution. D, I–V relations of membrane conductance in the pre-shrunk oocyte in hypertonic (continuous lines) and isotonic (dashed lines) solutions. Hypertonic solution contained (mm): 120 KCl, 2 CaCl2, 260 mannitol, 5 Hepes-KOH (pH 7.2). Isotonic solution had the same ionic composition but no mannitol was added.

Similar articles

Cited by

References

    1. Achard J-M, Bubien JK, Benos DJ, Warnock DG. Stretch modulates amiloride sensitivity and cation selectivity of sodium channels in human B-lymphocytes. American Journal of Physiology. 1996;270:C224–234. - PubMed
    1. Ackerman MJ, Wickman KD, Clapham DE. Hypotonicity activates a native chloride current in Xenopus oocytes. Journal of General Physiology. 1994;103:153–179. - PMC - PubMed
    1. Arellano RO, Miledi R. Functional role of follicular cells in the generation of osmolarity-dependent Cl− currents in Xenopus follicles. The Journal of Physiology. 1995;488:351–357. - PMC - PubMed
    1. Arellano RO, Woodward RM, Miledi R. A monovalent cation conductance that is blocked by extracellular divalent cations in Xenopus oocytes. The Journal of Physiology. 1995;484:393–604. - PMC - PubMed
    1. Barish ME. A transient calcium-dependent chloride current in the immature Xenopus oocyte. The Journal of Physiology. 1983;342:309–325. - PMC - PubMed

Publication types

LinkOut - more resources