- 1Institutes for Robotics and Intelligent Manufacturing, Chinese Academy of Sciences, Shenyang, China
- 2Optoelectronic System Laboratory, Institute of Semiconductors, Chinese Academy of Sciences, Beijing, China
- 3College of Materials Science and Opto-Electronic Technology, University of Chinese Academy of Sciences, Beijing, China
Fiber optic sensors are expected to be an auxiliary measurement tool in the field of ocean observation due to their small size, easy networking, intrinsic immunity to electromagnetic interference, and many other advantages. In recent years, the research around fiber optic sensing technology in the field of physical ocean observation has received increasing attention from researchers. According to the different measurement objects and measurement principles, the focus is on the seawater temperature sensor based on fiber grating, seawater salinity sensor, seawater pressure sensor, seawater salinity sensor based on multi-core optical fiber, seawater salinity sensor based on Michelson and Mach-Zehnder interferometry, seawater pressure sensor based on Fabry-Perot cavity, fiber optic temperature salinity and depth sensors based on resonant and coupling technology, flow velocity sensor based on multi-core optical fiber and fiber optic turbulence sensors based on thermal dissipation and turbulent kinetic energy dissipation. The test methods and test results of various sensors are analyzed, and the advantages and disadvantages of the technologies are pointed out. Prospects for the application of fiber optic sensors in physical ocean observation are presented.
Introduction
70.8% of the Earth’s surface is covered by seawater, but less than 5% of the oceans are currently known to mankind. The UN State Party document stated in May 2001: “The 21st century is the century of the ocean.” The ocean is the space on which human beings live, and we cannot live without it. Rich in marine biomineral resources, it is an asset to support the sustainable development of human beings. The progress of oceanographic research is of great significance to solve the major scientific problems facing mankind today, such as extreme climate, global warming, and the origin of species.
Because it stores a thousand times more heat and ten times more carbon than the atmosphere, the ocean can be called the “memory” of the climate system. According to statistics, between 1973 and 2013, the oceans absorbed 93% of the accumulated heat energy in the Earth’s climate system [1]. Therefore, understanding how and where the ocean absorbs heat is critical to understanding how the Earth will warm and become faster as greenhouse gas concentrations increase. In addition to its moderating effect on climate, the ocean is closely linked to human life in many ways, and it provides a variety of social, cultural, resource and environmental benefits.
The main tools that humans rely on to understand the laws of the ocean and to use them for the benefit of humans are marine environmental monitoring and ocean surveys which can help humans to better understand the ocean climate and ecosystems as well as human impacts on marine environment [2]. Global warming is currently causing glaciers to melt [3], and increased CO2 uptake is causing ocean acidification, which are both at an alarming rate. Sustained and effective observations in deep and remote ocean areas may even provide data support and guidance for accurately modeling global climate change and monitoring the impacts of climate change mitigation plans.
In addition, marine scientific research can help human beings understand the direction of energy transfer and dissipation pathways of the Earth, and is expected to help human beings solve some of the most challenging basic scientific problems in the 21st century, such as the basic scientific problems related to the origin of life and the flow of energy on Earth, the dispersion of sediments on the ocean floor and the understanding of the evolution of ecological processes.
In 1998, atmospheric and oceanic scientists from the United States and Japan proposed a global ocean environment observation project, Array for Real-time Geostrophic Oceanography, which opened a new era in the field of ocean environment observation. Argo plans to establish an ocean observation network to put enough cost-effective, satellite-trackable automatic detection buoys into the ocean. the launch of the Argo program has received rapid response and support from more than 10 countries, including Australia, Canada, France, Germany, Japan, South Korea, etc. In 2002, China officially announced its participation in the organization and implementation of the Argo international program. After nearly 20 years of joint efforts, the Global Argo Ocean Observing Network, consisting of over 3,000 Argo profiling buoys, is now in place, providing continuous access to monitoring information on seawater temperature, depth, and salinity and current velocity up to 2,000 m depth, and is freely available for research and application by scientists worldwide. In addition, the ocean observing programs of various world ocean powers have been active in observing temperature, salinity, pressure and currents and waves of the physical ocean, such as OOI [4], MARS [5], and DOOS [6, 7] in the United States; ONC [8], NEPTUNE [9], and VENUS [10] in Canada; ESONET [11, 12] and EMSO [13] in Europe; and ARENA [14, 15] and JAMSTEC [16] in Japan.
Ocean observation technology has promoted the development of marine science, and ocean observation capability is also an important symbol of a country’s comprehensive national power. From the key ocean observation plans of various countries and regions, it is not difficult to find that the observation of ocean temperature, salinity, pressure and various scales of currents and waves are indispensable observation contents.
Observations of ocean temperature, salinity, and depth are the most fundamental elements of ocean surveys, and ocean temperature, salinity, and depth data can provide background physical parameters for biogeochemistry and marine ecosystems [17–19], in addition to providing necessary compensation parameters for other ocean sensors and calculations of ocean acoustic propagation. For example, the speed of sound in the ocean increases with the temperature, salinity, and pressure of seawater [20]. Although the amount of change in the value of the speed of sound is small, this change can have a significant impact on the distribution of long-distance propagating sound lines, range, propagation time, and other quantities that generally require accurate values of the speed of sound [21], and it is for this reason that ocean temperature information, depth information, and salinity (conductivity) information are also important for ocean monitoring [22]. In recent years, scientists have also made a lot of progress in the development of ocean temperature and salinity depth sensors.
Research Progress of Temperature, Salinity and Depth Fiber Optic Sensors
Electronic-type seawater temperature and salinity depth sensors such as CTD systems have many advantages such as high accuracy and wide practicality, and are still as the main means of observation applications in the industry. However, there are still some shortcomings, for example, the system is usually more expensive, large, susceptible to electromagnetic interference, and not applicable to the surface and micro-nano scale of seawater for detection [23]. In addition, in order to obtain salinity and temperature data for a certain depth of the ocean, it is necessary to use CTDs in series in sea trials, which greatly increases the cost. Therefore, fiber-optic sensors are expected to receive increasing attention as a complementary measurement to electronic-based CTDs because of their high sensitivity, high temperature resistance, ease of multiplexing, in situ measurements, and resistance to external electromagnetic interference.
However, it must be noted that the current means of optical measurement of seawater salinity still has certain limitations. First of all, the measurement equipment, especially the light source and structure of the limitations, generally are the spectral lines of metals or rare gases, limited to the visible range, and the general measurement accuracy of the device can only reach 1–10 ppm, followed by the test calibration with the choice of standard seawater is not uniform and the lack of relatively consistent reference, resulting in optical measurement does not have a high degree of confidence conductivity, and the system is complex and expensive, and therefore always In a relatively auxiliary position. In addition, it is known that seawater has dispersion properties like any other matter. Through literature research, we know that the refractive index difference caused by the wavelength difference of 300 nm in the visible band is −0.013, which is 1.44 times of the refractive index difference of 0.009 caused by 43‰ salinity, it is inaccurate to test salinity by refractive index ignoring the dispersion effect. In addition, because the pressure is also an important factor affecting the refractive index, for example, 100 MPa in the visible band causes a measured refractive index change of about 0.015, which is 1.67 times the salinity of 43‰ salinity causing a refractive index difference of 0.009. Therefore, ocean salinity measurement requires in-situ measurement and the introduction of real-time measurement pressure in the calculation equation.
Temperature, salinity and depth sensors based on fiber optic sensing principles have been reported in many papers domestically and abroad. They mainly include conventional short-period fiber Bragg gratings (FBG), long-period fiber gratings (LPG), multicore fibers, Michelson and Mach-Zehnder interferometer, fiber Fabry-Perot cavity interferometer, microfiber knot/coil resonators, highly birefringent elliptic fiber Sagnac rings, optical microfiber couplers, etc. Each of these sensors has advantages and disadvantages, and some typical papers will be selected and presented below.
Seawater Temperature Salinity and Depth Sensor Based on Fiber Optic Grating
In 2005, French scientists reported in Oceans [24] the temperature and salinity sensor using the process of FBG and LPG integration and proposed a 48element observation array, but the temperature sensitivity of FBG is only 51 pm/°C and the salinity sensitivity of LPG is 4.6 pm/g/L. According to the national standard GB/T 23,246–2009 conductivity temperature Depth profiler” technical indicators, the CTD is divided into three levels, and this sensitivity of the temperature and salinity sensor can only reach the second level of standards, however it fully demonstrates the advantages of fiber-optic grating sensors for networked measurements.
In 2014, a highly sensitive pressure sensor based on a fiber Bragg grating (FBG) with an integrated thin metal diaphragm was designed and investigated theoretically and experimentally at the Indian Institute of Technology (IIT) which publish in Journal of Optics. Under pressure, the deflection of the diaphragm results in an axial tensile strain along the length of the FBG; the pressure sensitivity of the sensor obtained from the test results is about four orders of magnitude higher than that which can be measured by a bare FBG. Figure 1 shows a schematic structure of the pressure sensor.
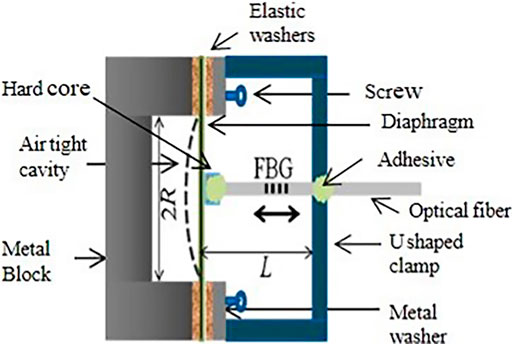
FIGURE 1. The schematic structure [25].
The advantage of pressure sensors encapsulated with diaphragm is that a relatively high sensitivity can be achieved through the design of mechanical structures and materials which require the high processing technic. In addition, pre-stress needs to be applied before combining diaphragm with fiber, so it is also a challenge for the long-term stability of the sensor. While this type of sensor can be adapted to more harsh electromagnetic interference environment than electronic sensors.
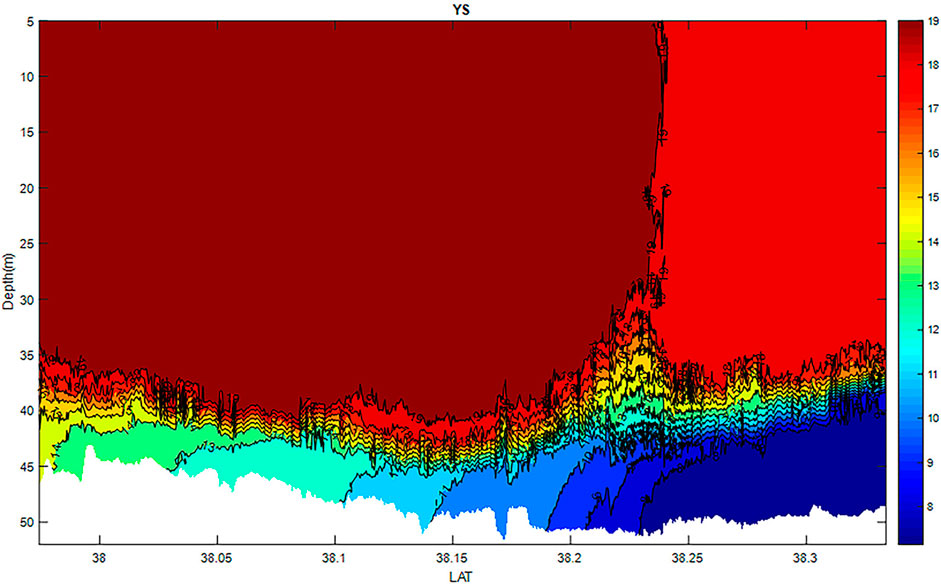
During 2013–2018, with the support of CAS pioneering special projects, Fang Li‘s team at the Institute of Semiconductors, CAS, independently developed a temperature and depth sensor array based on short-period fiber Bragg grating, of which the depth sensor is the pressure sensor, which integrates 120 temperature and pressure sensors into a 630 m-long towing chain. The sensing system can observe the temperature and depth profiles of the ocean with high spatial resolution while the ship is running (see Figure 2), which greatly improves the efficiency of ocean surveys.
In terms of long-period fiber gratings, in 2016, Northeastern University measured the refractive index using a long-period grating made from photonic crystal fiber which is published in Instrumentation Science and Technology. The sensitivity was up to 2,343 nm/RIU within 1.33–1.34 with a resolution of 8.5 × 10⁻⁶RIU, which is the highest sensitivity that can be achieved using a long-period fiber grating scheme. Figure 3 shows a schematic of the measurement system and its sensor structure.
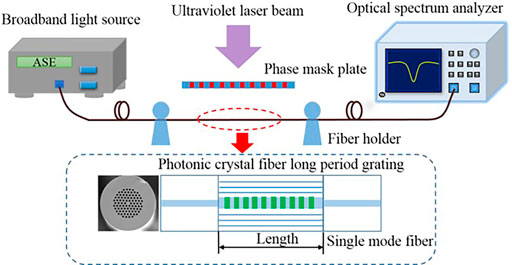
FIGURE 3. Schematic of the measurement system and its sensing structure [26].
In 2017, the refractive index sensor (salinity sensor) was developed by Prof. Lianqing Zhu‘s team at Beijing University of Information Technology [27] using a femtosecond laser to make a long period grating with a sensitivity of 332 nm/RIU. the same year (2017) two long period gratings made from special optical fiber PS-1250/1,500 at Indian Institute of Technology also obtained a highly sensitive refractive index sensors [28]. After converting, both long-period solutions can reach the secondary standard of the technical index of the National Standard GB/T 23,246–2009 Conductivity Temperature Depth Profiler. However, this paper believes that the technology still has a long way to go toward application, and the first issue to be solved is the attachment of marine pollutants or algae.
In 2018, Jilin University reported long-period gratings with periods of tens of μm [29], and the team used femtosecond laser inscription to develop a grating with a period of 40 μm, a period length between long-period gratings and Bragg gratings, and its spectral properties between them as well. Therefore, the advantage of this sensor is that it has both the reflection characteristics of Bragg gratings and the transmission characteristics of long-period gratings, and the two types of gratings work simultaneously to eliminate cross-sensitivity to temperature and refractive index. However, the disadvantage is that the line width is too large for high precision measurement with long-period gratings.
In the same year (2018), Fang Li’s team at the Institute of Semiconductors, Chinese Academy of Sciences, designed and fabricated a high-resolution long-period fiber grating refractive index sensor. A cascaded long-period fiber grating scheme was used, combined with a high-precision demodulator to improve the measurement resolution. A higher sub-cladding mode and an etched fiber cladding were used to improve the refractive index sensitivity of the long-period fiber grating. The resulting sensor sensitivity is −344.04 nm/RIU and the resolution is on the order of 10–6 RIU. The experimental team designed and fabricated a high-sensitivity long-period fiber grating temperature sensor. The sensitivity of the fabricated sensor is 1.26 nm/°C, which is about 10 times higher than that of a normal long-period fiber grating.
During 2019–2020, Chongqing University of Technology [30, 31] reported a study on long-period fiber grating refractive index sensors coated with graphene. The average refractive index sensitivity of the graphene-coated long-period fiber grating refractive index sensor (GO-LPFG) was improved by 1.09 times compared with that of the uncoated GO-LPFG. The average refractive index sensitivity of GO-LPFG is further improved as the grating diameter decreases. GO has a unique two-dimensional structure that makes it more responsive and biocompatible, and the hydrogen bonding between GO and hydroxylated grating sensing makes GO firmly bonded to the grating surface to form a GO-LPFG, which is a very good hydrophilic and biocompatible sensor.
Seawater Salinity Sensor Based on Multicore Fiber
In 2013, J. R. Guzman-Sepulveda of the University of Central Florida, Orlando, Florida, United States, published a paper on a highly sensitive fiber optic salinity sensor that can be applied to marine measurements. This is a simple and compact fiber optic sensor based on Two-Core fiber (TCF) that can perform high-sensitivity salinity measurements. The salinity measurement range is from 0 to 5 M (M is mol/L) and 0–1 M, and the sensitivity is 14.0086 nm/M and 12.0484 nm/M, respectively, and the sensing schematic is shown in Figure 4.
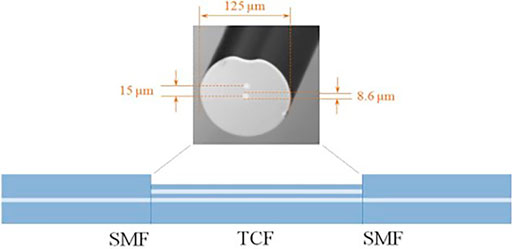
FIGURE 4. Schematic of the TCF salinity sensor [32].
It is conclusively concluded from the current experimental reports that the sensitivity of the dual core salinity sensor is still relatively high, but it is not suitable for multiplexing. In addition, considering the problem of impurity adhesion inside the seawater, whether the dual fiber core salinity sensor can be successfully applied in sea trial is yet to be further verified.
During 2018–2019, Yuefeng Qi’s team at Yanshan University developed a research on the refractive index and temperature sensing characteristics based on a micro-nano-multi-core fiber optic sensor. The experimental team specifically selected seawater samples of unknown salinity to verify the measurement error of the refractive index sensor based on micro-nano-multi-core optical fiber and concluded that the refractive index sensitivity of the sensor with the pull cone length of 16.20 mm structure is 5,815.50 m/RIU, and the actual measurement error is less than 0.35‰. Cross-sensitivity of micro-nano-multi-core fiber optic sensor with temperature can be solved by encapsulating an FBG [33].
Seawater Salinity Sensor Based on Michelson and Mach-Zehnder
In 2012, C.R. Liao et al. [34]. from the Hong Kong Polytechnic University proposed an interferometric sensor based on an opto-open microcavity for fiber-in-line Michelson. This sensor uses femtosecond laser technology to inscribe a semi-open concave cavity at the end of a single-mode fiber with refractive index sensitivity up to 975 nm/RIU. In 2014, Y. Zhang et al. [35]. from Harbin Engineering University proposed a single-mode fiber based inter-mode interferometric refractive index sensor. It fuses a small segment of multimode fiber to a single-mode fiber at one end and plating a gold film at the other end to form a Michelson sensing structure. This structure sensor has a simple structure, low optical wave loss, and refractive index sensitivity up to −110.5 nm/RIU. In 2016, an all-fiber Michelson interferometric sensor was proposed by L. Li et al. [36] at Shandong University of Science and Technology. A section of ultra-fine core fiber is fused to a single-mode fiber at one end, and a Faraday rotating mirror at the other end makes the optical signal reflect back. The structured sensor has a refractive index sensitivity of −48.85 nm/RIU in the refractive index interval of 1.38–1.435, and it has the advantages of simple fabrication, high stability, and low optical power loss.
In 2018, Dasun Su et al. of Jinan University designed a single-ended reflective Mach-Zehnder interferometer, in which two sections of optical fiber are symmetrically staggered and fused at both ends of a section of single-mode fiber of several hundred microns in length, and the end surface of one section of the fiber is coated with a gold film so that the transmitted light is reflected at the end surface. The interference phenomenon occurs due to the optical range discrepancy between the external environment and the transmitted light waves inside the cladding material. The experimental results show that the refractive index sensitivity is -13,257 nm/RIU at a bias of 62.5 μm and a cavity length of 554 μm. This structure sensor can achieve ultra-high sensitivity measurement, but the disadvantage is that it is difficult to fabricate. The schematic and physical diagrams are shown in the Figure 5.
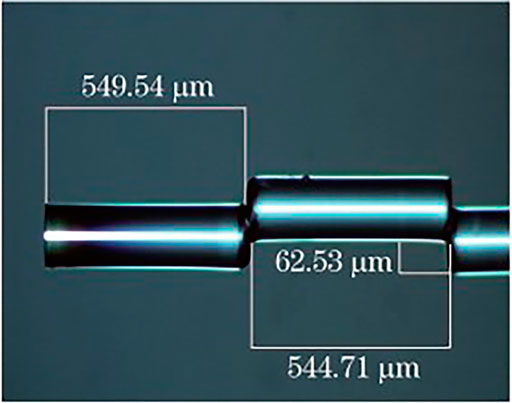
FIGURE 5. Physical microscopic view of the sensor probe [37].
Seawater Pressure Sensor Based on Fabry-Perot Cavity
In 2001, A. Wang et al. of Virginia Tech [38] used capillary tubes and optical fibers to generate a Fabry-Perot cavity for pressure sensing by changing the cavity length through lateral pressure on the capillary tubes, and the highest measured pressure was 41.4 MPa. In 2011, J. Ma et al. of the Hong Kong Polytechnic University [39] fabricated a pressure-sensitive microbubble-type Fabry-Perot cavity by arc welding on the fiber end surface, and measured pressures up to 40 MPa.
In 2012, Z. Liu et al. of the Hong Kong Polytechnic University [40] used twin-core photonic crystal fiber (TC-PCF) fused to a single-mode fiber to fabricate a Fabry-Perot cavity, and pressure measurements from 0 to 45 MPa were achieved under laboratory test conditions. The following Figure 6 the SEM photo of TC-PCF in cross section of fiber.
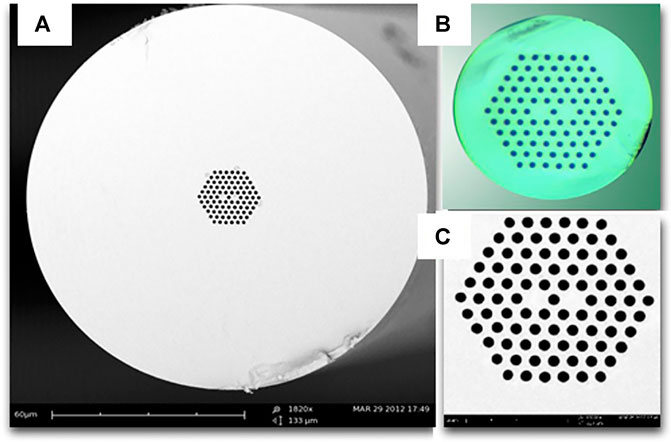
FIGURE 6. (A) The microscope photo of the cross section of the cane and the SEM photos of the TC-PCF: (B) the whole fiber; (C) holes section.
This photonic crystal Fabry-Perot cavity sensor has a compact structure and higher sensitivity than ordinary FBG sensors.
In 2016, Professor Tiegen Liu’s team at Tianjin University integrated microelectromechanical technology and fiber optic sensing technology to make a Fabry-Perot cavity pressure sensor. This sensor has the characteristics of high sensitivity and consistency. The structure diagram of the Fabry-Perot cavity large pressure sensor is shown below. As can be seen from the Figure 7, the sensor mainly consists of a sensor chip, a borosilicate glass capillary and a multimode optical fiber. The borosilicate glass capillary tube realizes the fixation and support of the sensing diaphragm as well as the connection and collimation between the sensing diaphragm and the multimode optical fiber. The multimode optical fiber is used as a transmission medium for light and is closely fitted to the sensor chip via the glass capillary. The sealed connection between the sensor chip and the glass capillary is realized by inorganic solder, and the multimode fiber is sealed and fixed to the glass capillary by epoxy resin structural adhesive.
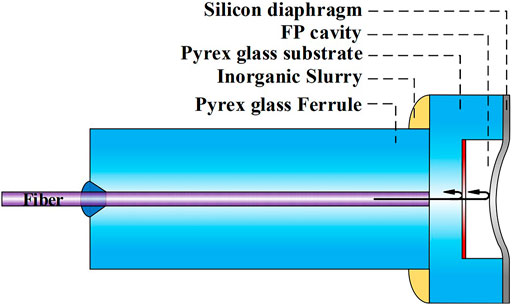
FIGURE 7. Fiber optic Fabry-Perot high pressure sensor core structure [41].
As the sensing system works, the light from the light source is transmitted vertically through the multimode fiber to the sensing diaphragm, and part of the light is reflected by the reflective film on the bottom surface of the microcavity, and part of the light is reflected back to the fiber by the bottom surface of the monocrystalline silicon diaphragm after passing through the vacuum F-P cavity, and the two beams of light have low coherent interference. When the external pressure changes, the pressure-sensitive diaphragm bends under the pressure, changing the optical range difference between the two beams and thus producing different low-coherence interference bands. By demodulating the low-coherence interference fringes, the corresponding pressure values can be obtained, thus enabling high-precision pressure sensing.
As shown in Figure 7, the design of the cavity length is a very important parameter indicator. The sensor requires extensive aging experiments before application, while the robustness and stability of the sensor also need to be verified by extensive experiments. In addition, the heat resistance and temperature repeatability of the sensor need to be further investigated to explore better temperature compensation methods.
In 2020, Yi Jiang et al. [42] from Beijing University of Technology proposed a sensor to simultaneously measure pressure and temperature. The research team fused a segment of hollow fiber between a normal optical fiber and a photonic crystal fiber to form an interferometric structure. The hollow fiber segment constitutes a non-intrinsic Fabry-Perot interferometer that uses the micro-apertures of the photonic crystal fiber to communicate with the external environment. The experimental results show that the sensor can work consistently at temperatures from 28 to 800 °C and pressures from 0 to 10 MPa, with a temperature sensitivity of up to 17.4 nm/°C in the measurement range and a pressure sensitivity that decreases with increasing temperature up to 1,460.5 nm/MPa at 28°C.
Fiber Optic Temperature Salinity and Depth Sensors Based on Resonant and Coupling Technology
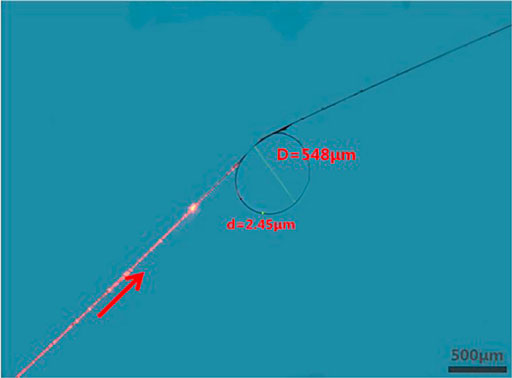
In 2014, Hongjuan Yang et al. [43] designed a seawater temperature sensor based on microfiber knot resonator (MKR-Microfiber Knot Resonator) at Ocean University of China. Figure 8 shows the optical microscope image of a 548-μm-diameter MKR with a 2.45-μm-diameter microfiber. As shown in Figure 9, the sensing sensitivity increases as the microfiber diameter increases in the range of 2.30–3.91 μm and with the increase of the detection light wavelength, which is in close match with the experimentally obtained results. The maximum sensitivity measured can reach 22.81 pm/°C by choosing the appropriate parameters.
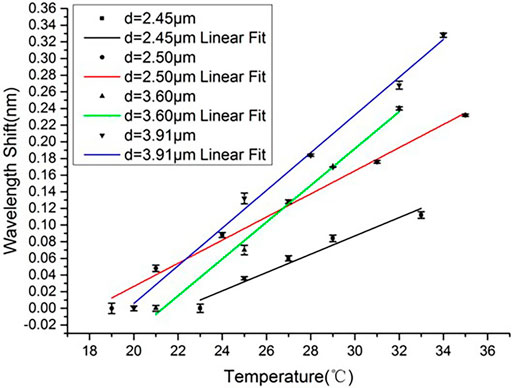
FIGURE 9. The linear fittings of resonant wavelength with temperature for MKRs with fiber diameters of 2.45-, 2.50-, 3.60- and 3.91-μm. The error bars show the differences between experimental and fitting results.
In 2015, Xin Wang et al. from Ocean University of China proposed a new method of seawater temperature sensing based on the Sagnac ring of high birefringence elliptic fiber (HBEF-high-birefringence elliptic fiber), whose measurement principle is to use the linear relationship between temperature change and interference peak displacement. The sensing sensitivity increases with the increase of HBEF length and the decrease of wavelength. Figure 10 shows the simulate spectrum when HBEF length is 5.5 cm (Red), 7.8 cm (Blue), 29.9cm (Green) and 98.9cm (Black). By optimizing the parameters of the detection system, a temperature sensing sensitivity of 472 pm/°C, a detection range of 10°C–30°C, a wavelength of 1,310 nm (communication wavelength), and a fiber length of 98.9 cm were acquired.
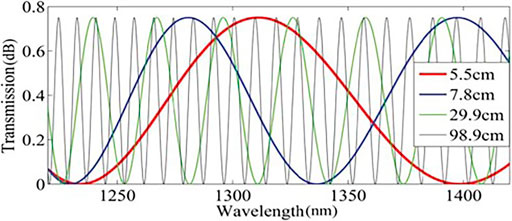
FIGURE 10. Simulate spectrum when L is 5.5 cm (Red), 7.8 cm (Blue), 29.9cm (Green) and 98.9 cm (Black). [44]
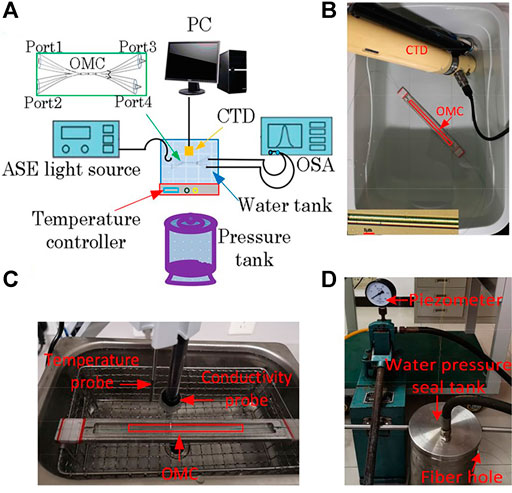
SCHEME. (A) Schematic of the experiment setup for the measurement of salinity, temperature and depth in seawater. (B) The salinity measuring experimental setup and the optical microscopic image of an OMC sample (Inset). (C) The temperature measuring experimental setup. (D) The depth measuring experimental setup [45].
In 2019, Yu Yang et al, National University of Defense Technology, developed an all-fiber optic seawater CTD sensor based on Optical Microfiber Coupler -OMC whose experiment setup is shown in Figure 11. It is based on the improved flame brush method, and two conventional optical fibers are twisted into one thin bundle to make the OMC. In situ measurements of seawater salinity, temperature and depth (pressure) can be achieved by monitoring the induction inclination. The water depth (pressure) sensitivity of the OMC is 50 times higher than that of the bare fiber grating (0–25 MPa range); the highest sensitivity of salinity, temperature and depth are 1,596 pm/‰, 2,326 pm/°C, and 169 pm/MPa, respectively. This is ambitious enough for a dynamic ocean environment monitoring and fiber optic hydrophone underwater target detection system.

FIGURE 11. From left to right: Two-core fiber, three-core fiber, four-core fiber, seven-core fiber [52].
Laboratory-developed sensors are bound to practical applications. The main determinants of performance are reliability and stability. Without reliability and stability research work and sea trial evidence, the sensor cannot be practically applied to ocean observation. However, few performance studies on these aspects have been reported in the domestic and international papers.
In terms of fiber optic temperature sensors, the papers have reported high sensitivity of many solutions from the principle side, but for its comprehensive performance such as pressure and salinity to temperature cross-sensitivity, response time, long-term stability, vibration shock resistance and other research is comparatively limited.
In terms of pressure sensors, although a significant amount of civil construction projects in China have spawned the development of commercially available fiber optic pressure sensors, the long-term stability index still falls a certain gap compared to the mature electronics pressure sensors. Dynamic response and real-time temperature compensation still suffer from a lack of research reports.
In terms of salinity sensors, firstly, a common standard has not yet been formed. How can the refractive index measured by optical sensors be related to the state parameters of seawater (salinity, temperature, pressure) in a precise quantitative way? This process may require an iterative process like the formation of different salt standards for salinity measurement by conductivity. Secondly, proof-of-principle, single solute experiments are mostly reported, and sea trial applications are less reported. Thirdly, almost all schemes for optical refractive index measurements are affected by adhesion, and engineering studies in this area are almost blank.
Marine science is based on the science of marine survey, and the fundamental of marine survey is reliable performance of various types of sensors. In the background of the era of marine research towards the ocean and abyss, marine scientists have put forward higher requirements for the supporting technology of the survey. How to apply the new principles and technologies in the field of fiber optic sensing to the deep ocean? The most important thing is to make the laboratory outcomes to practical through a significant number of engineering applications.
Physical oceanography is the basic subject of marine science, and the research includes the momentum, energy and substance transport processes in the ocean and their variation regulations, whose basic research object is the motion of seawater. Seawater motion moves from large scales to small scales and eventually dissipates in the form of turbulent mixing. Ocean turbulent energy dissipation processes have become an important research focus in physical oceanography [46]. However, the study of turbulence has not been completely solved so far, and the turbulence problem has been considered as a difficult problem in fluid mechanics. It took more than 100 years of unremitting research to realize that turbulence is a three-dimensional spatially irregular and non-constant motion, which belongs to a spatial-temporal stochastic process [47].
Research Progress of Fiber Optic Fluid Velocity Sensor
Recently, papers related to ocean currents, especially turbulence, have been published in Nature, Science, and their sub-publications.
In 2017, Alberto C [48] of the UK National Oceanography Centre published a paper in Nature stating the rapid dissipation of turbulent mixing that ultimately precipitates meltwater to depth. Alberto C et al. demonstrated that this mechanism is related to the accelerated melting of the Antarctic ice shelf with an ideal ocean circulation model and suggested that this mechanism for generating deep meltwater - a dynamically robust feature of Antarctic melt - should be incorporated into climate-scale models.
In 2018, Johanna Bergkvist et al. [49] of the Leibniz Institute of Freshwater Ecology, Germany, reported in Nature communications that they used secondary ion mass spectrometry combined with stabilized isotope tracers to measure, under stationary preconditions and turbulent shearing at low nutrient concentrations, the cellular Specific carbon, nitrate and ammonium assimilation were measured under low nutrient concentrations and turbulent shear in two chain-forming diatoms (Skeletonella and Hornwort) and the data were compared with those predicted by mass transfer theory. It was demonstrated that turbulent shear significantly increases cell-specific assimilation and cell/chain formation of rapidly sinking, carbon- and ammonium-rich aggregates compared to stationary conditions. Thus, it was demonstrated that turbulence stimulates both the small-scale biological CO2 assimilation and the large-scale biogeochemical carbon and nitrogen cycle in the ocean.
Turbulence in the benthic boundary layer is important for the formation and destruction of ocean aggregates, but a small number of field observations limit our understanding of the role of turbulence in ocean surface aggregation processes, according to a 2019 paper in Scientific reports by the Tokyo University of Marine Science and Technology. The formation of ocean aggregates (known as ocean snow) through the condensation of particles of size (>0.05 cm) contributes significantly to global carbon fluxes by sinking from eutrophic zones and affects the Earth’s climate [50].
In 2020, the Institute of Oceanography [51], Chinese Academy of Sciences studied the coherent and incoherent characteristics of the internal tide in the northern South China Sea through observations and numerical simulations. The turbulence parameterization model was demonstrated to be related to tidal and internal tides by 11 months of moored currents observation, and the associated results were reported in Scientific reports.
Substantial breakthroughs in physical oceanography are inseparable from the innovation of observational instruments and detection techniques [55]. The development of physical oceanography is based on the innovation of monitoring means. To provide marine scientists with a more profound knowledge and understanding of the processes and mechanisms of ocean mixing, the evolution of ocean patterns, and climate models of the oceans, it is extremely imperative to carry out research on ocean current velocity and turbulence observations.
Flow Velocity Sensor Based on Multi-Core Optical Fiber
In 2008, Harbin Engineering University proposed a fiber optic fluid velocity sensor based on a two-core fiber optic Michelson interferometer. The sensor consists of a two-core optical fiber and a cylindrical cantilever beam. The fluid flows at an unknown velocity and the resulting force bends the fiber, which corresponds to the shift of the phase of the integrated Michelson interferometer within the dual-core fiber. The two-core fiber optic sensing technology can self-compensate for the environment temperature and pressure variations due to the influence of ambient temperature and pressure variations in both arms of the interferometer.
The advantages of this dual-core fiber flow sensor are Simple and compact structure; unaffected by environmental temperature and pressure changes; sensitivity is independent of the length of the dual-core fiber optic cantilever beam; and sensitivity can be adjusted by turning the dual-core fiber optic in the direction. This sensor can also be applicable to the measurement of seawater flow velocity.
In 2019, Prof. Yuefeng Qi’s team at Yanshan University reported research work on multi-core optical fiber flow velocity/fluid direction measurement technology.
The principle is to inscribe Bragg gratings of different wavelengths on multi-core optical fibers, and the advantage of this sensor is that it can measure both curvature and force direction, which can be applied in the marine environment to achieve simultaneous measurement of flow velocity and flow direction, and can effectively eliminate the influence of environmental temperature on experimental measurements. The study is still in the laboratory research stage and lacks application tests in an actual hydrological environment. In addition, the demodulator and control platform accuracy, if further improved, is expected to allow better sensor performance.
Two Ocean Turbulence Sensors Based on Fiber Optic Sensing
There are two forms of turbulence dissipation, one is turbulent kinetic energy dissipation and the other is thermal dissipation. The measurement of turbulent energy dissipation rate is currently based on piezoelectric ceramic methods internationally. Thermal dissipation has been reported for the fast temperature sensor FP07, which has a response time of 7 ms. How to design the fiber optic sensor with fast response time and high sensitivity is a challenging problem for research.
In 2015, a key laboratory in the United States proposed a methodology based on Fabry-Perot cavity interference to measure the variation of seawater temperature and compared it with the signal measured by FP07. The structure of the sensor head is shown in the Figure 12. The cylindrical silicon is mounted on the end surface of a single-mode fiber. The silicon cylinder works as a Fabry-Pollo cavity interferometer, where two reflections at the interface between the fiber silicon and the silicon surroundings combine and transmit back an interference spectrum, characterized as a series of tilted wavelengths and peak wavelengths.
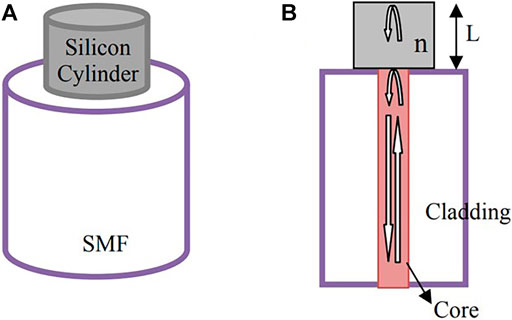
FIGURE 12. (A) Diagram of sensor probe structure (B) Description of working principle [53] .
As shown in Figure 14, turbulence is generated by pouring hot water into a bucket of cold water. The fiber optic sensor was compared to a commercial fast response thermistor (FP07), which can be used both as a reference and as a calibration. The two sensors were positioned near each other. A comparison of the two sensors is shown in the Figure 13. Obviously, the fiber optic sensor tracks the FP07 thermistor and tracks more details of the rapid temperature change.
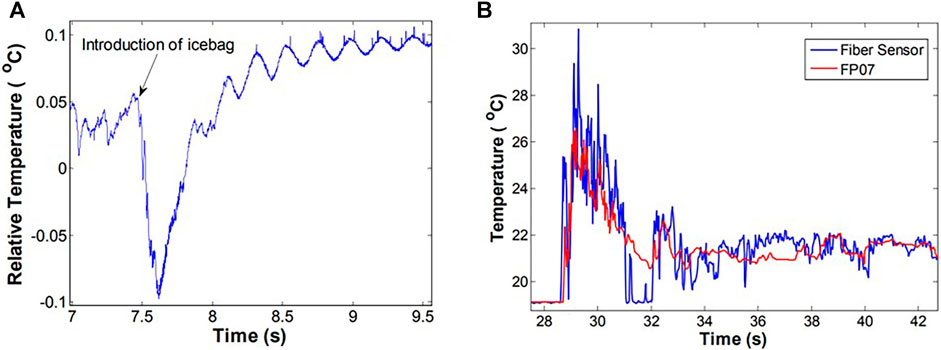
FIGURE 13. (A) Place an ice pack on the surface of the water (b) Measure turbulence by pouring some hot water into a bucket of cold water. In (B), the response of a commercial high-speed thermistor FP07 is provided for calibration and reference [53].
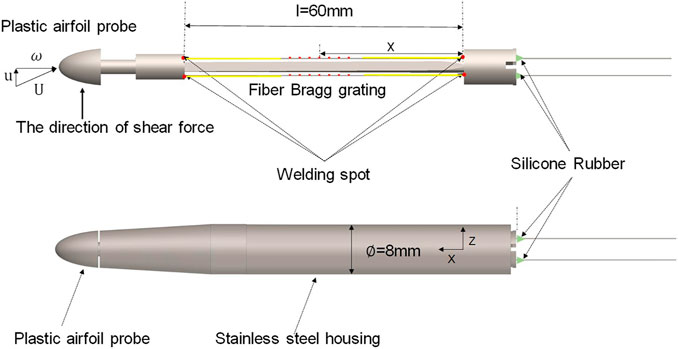
FIGURE 14. Package structure diagram of the sensor [54].
The experimental results demonstrate the possibilities of fiber optic sensing in the field of fast variable temperature measurement, and provide a broad prospect for oceanographic applications.
In 2020, Fang Li‘s team at the Institute of Semiconductors of the Chinese Academy of Sciences used a FBG as the sensing element, and the demodulation technology based on phase generate carrier (PGC), completed sensor probes and demodulator prototype in the laboratory with the wing-shaped probe and equal-strength titanium alloy cantilever beam. The Figure 15 shows the package structure diagram of the sensor. The system can measure the rate of change of tangential velocity caused by ocean turbulence. The resolution of the demodulation system reaches
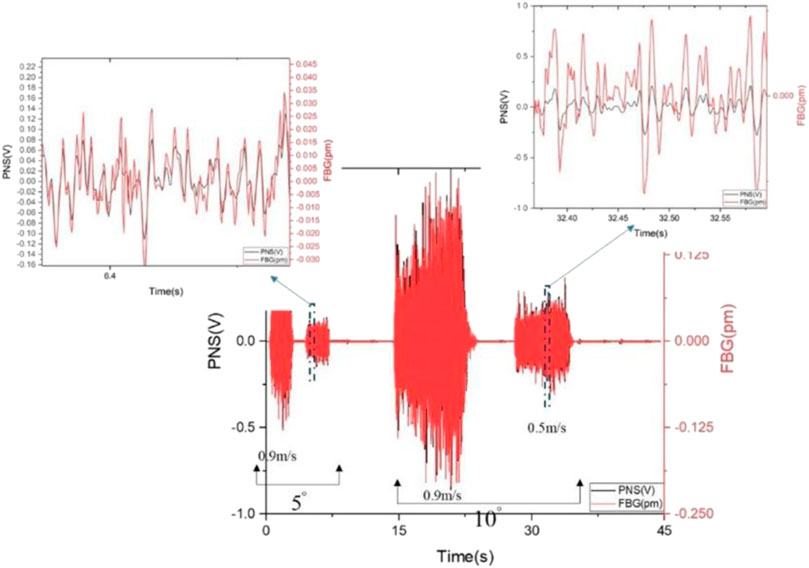
FIGURE 15. Correlation comparison chart - PNS signal vs FBG signal [54].
The laboratory-calibrated signal correlation between the two sensors reached 0.91607. The application of this sensor is expected to contribute to solving the current gap of turbulence measurement data near the marine ground boundary layer.
At the time being, there are few reports related to the research on the application of fiber optic sensing in the field of ocean turbulence measurement. The international situation is the research of turbulence sensor carriers, such as developing more stable turbulence profiler platforms, or carrying underwater gliders.
Summary and Prospect
On the one hand, the traditional marine electronic temperature, salinity, depth, and flow (turbulence) sensor manufacturing field is occupied by countries such as the United States, Germany, and Canada. On the other hand, in the field of fiber optic sensing, domestic scholars are in the first rank of the international level with active innovations and excellent experimental phenomena. However, there are still multiple deficiencies in fiber optic sensors for ocean temperature, salinity, depth, and flow velocity (turbulence).
The advantages of fiber optic temperature sensors are intrinsic insulation of the sensor and transmission cable, resistance to electromagnetic interference; low cost of the probe, easy to multiplex; in-situ measurement. But the disadvantage is that the principle of demodulation equipment is generally complex; high precision demodulator is expensive; the current mature product accuracy is not enough (less than 0.001°C).
The advantage of the fiber optic salinity sensor is its high sensitivity, but it has a long response time (higher than the 50 ms of electronic sensors). There is no uniform calibration protocol and measurement standard for fiber optic salinity sensors.
Fiber optic depth sensors have the advantages of high sensitivity and fast response time. However, the long-term stability and accuracy of fiber optic depth sensors need to be further improved.
Fiber optic flow velocity (turbulence) sensors have the advantages of low probe cost and high sensitivity, and are expected to bridge the gap of turbulent kinetic energy dissipation rate measurement data in the marine ground boundary layer. However, the calibration process of fiber optic flow velocity (turbulence) sensors is complicated and the demodulation equipment is vulnerable to environmental vibration and noise.
In the demodulation, fiber optic sensing technology also has limitations, such as reflective matched fiber grating filtering method has a low signal-to-noise ratio of the system, transmission fiber grating filtering method has a large nonlinear error problem, while the edge filtering method of the device is too sensitive to temperature and the temperature compensation error caused by the problem, high-precision tunable F-P filter demodulation system is expensive and filter loss.
If scientific researchers seize the opportunity to overcome the above-mentioned technical difficulties, it is likely to make a qualitative breakthrough in the field of physical ocean observation with fiber-optic sensors. At present, most research institutes and universities are limited to the laboratory and lack research on engineering applications. Laboratory sensors should focus on practical applications and get enough feedback from users in the process of engineering and marketing applications in order to drive the performance of our sensors to maturity in all aspects.
Author Contributions
LW and FL conceived and performed the papers and article writing; LW and YW were involved in the paper writing; SS and FL were involved in the paper review and editing. All the authors contributed to the discussion on the results for this article.
Funding
The work was supported in part by the Natural Science Foundation of China under Grant 61973297, in part by the Strategic Priority Program of the Chinese Academy of Sciences under Grant No. XDC03060105, and in part by the Youth Innovation Promotion Association of the Chinese Academy of Sciences under Grant 2020209.
Conflict of Interest
The authors declare that the research was conducted in the absence of any commercial or financial relationships that could be construed as a potential conflict of interest.
Publisher’s Note
All claims expressed in this article are solely those of the authors and do not necessarily represent those of their affiliated organizations, or those of the publisher, the editors and the reviewers. Any product that may be evaluated in this article, or claim that may be made by its manufacturer, is not guaranteed or endorsed by the publisher.
Acknowledgments
I would like to acknowledge FL, for inspiring my interest in the development of fiber optic sensing technology in the field of physical ocean observation.
References
1.IPCC. About IPCC (2020). Available from: https://www.ipcc.ch/report/ar5/wg1/[Z] (Accessed October 30, 2020).
2. Winton M, Griffies SM, Samuels BL, Sarmiento JL, Frölicher TL. Connecting Changing Ocean Circulation with Changing Climate. J Clim (2013) 26(7):2268–78. doi:10.1175/jcli-d-12-00296.1
3. Hock R, Rasul G, Adler C. High Mountain Areas: in: IPCC Special Report on the Ocean and Cryosphere in a Changing Climate, Bremen, Germany, International Journal of Precision Engineering and Manufacturing (2019).
4.OOI. About OOI, Available from: https://oceanobservatories.org/deep-ocean-observing-workshop-2018/about/[Z] (Accessed January 20, 2021). 2020.
5.MBARI. About MBARI. Available from: https://www.mbari.org/technology/[Z] (Accessed January 21, 2021). 2020.
6.Doos. About Doos. Available from: https://deepoceanobserving.org/[Z] (Accessed January 22, 2021). 2020.
8.Oceannetworks Canada. About Oceannetworks Canada. Available from: https://www.oceannetworks.ca/about-us[Z] (Accessed February 20, 2020). 2020.
9.NEPTUN. About NEPTUN. Available from: https://www.oceannetworks.ca/science/active-research/tsunami-studies[Z] (Accessed February 21, 2021). 2020.
10.Venus. About Venus. Available from: https://www.oceannetworks.ca/[Z (Accessed February 22, 2021)]. 2020.
11.ESONET. About ESONET. Available from: http://www.esonet-noe.org/About-ESONET[Z] (Accessed February 23, 2021). 2020.
12.ESONET. About-ESONET. Available from: http://www.esonet-noe.org/About-ESONET/Organization/Observatories[Z] (Accessed February 24, 2021). 2020.
13.EMSO. About EMSO. Available from: http://emso.eu/what-is-emso/[Z] (Accessed February 25, 2021). 2020.
14. Kasahara J, Shirasaki Y, Asakawa K, Kawaguchi K. Scientific Application of ARENA networks[C]. In: 2003 International Conference Physics and Control. Proceedings (Cat. No.03EX708); 25-27 June 2003; Tokyo, Japan. IEEE (2003).
16.JAMSTEC. About JAMSTEC. Available from: http://www.jamstec.go.jp/e/about/[Z (Accessed March 20, 2021)]. 2020.
17. Gonnella G, Böhnke S, Indenbirken D, Garbe-Schönberg D, Seifert R, Mertens C, et al. Endemic Hydrothermal Vent Species Identified in the Open Ocean Seed Bank. Nat Microbiol (2016) 1(8):16086. doi:10.1038/nmicrobiol.2016.86
18. de Boer AM, Sigman DM, Toggweiler JR. Effect of Global Ocean Temperature Change on Deep Ocean Ventilation[J]. Paleoceanography (2007) 22(2):A2210. doi:10.1029/2005pa001242
19. Archer D, Martin P, Buffett B, Brovkin V, Rahmstorf S, Ganopolski A. The Importance of Ocean Temperature to Global Biogeochemistry. Earth Planet Sci Lett (2004) 222(2):333–48. doi:10.1016/j.epsl.2004.03.011
20. Wilson WD. Equation for the Speed of Sound in Sea Water[J]. The J Acoust Soc America (1960) 10(32):1357. doi:10.1121/1.1907913
21. Dushaw BD, Worcester PF, Cornuelle BD, Howe BM. On Equations for the Speed of Sound in Seawater[J]. J Acoust Soc America (1993) 1(93):255–75. doi:10.1121/1.405660
22. Wilson WD. Speed of Sound in Sea Water as a Function of Temperature, Pressure, and Salinity[J]. J Acoust Soc America (1960) 6(32):641–4. doi:10.1121/1.1908167
23. Wang X, Wang J, Wang SS, Liao YP. Fiber-Optic Salinity Sensing with a Panda-Microfiber-Based Multimode Interferometer[J]. J Lightwave Techn (2017) 35(23):5086–91. doi:10.1109/jlt.2017.2764743
24. Marrec L, Bourgerette T, Datin E, Ferchaud N, Pucel B, Quetel L, et al. In-situ Optical Fibre Sensors for Temperature and Salinity Monitoring. Oceans (2005) 2:1276–8. doi:10.1109/oceanse.2005.1513243
25. Pachava VR, Kamineni S, Madhuvarasu SS, Putha K. A High Sensitive FBG Pressure Sensor Using Thin Metal Diaphragm. J Opt (2014) 43:117–21. doi:10.1007/s12596-014-0186-9
26. Haifeng H, Chao D, Qi W, Xiaoli W, Yong Z. High Sensitivity Internal Refractive index Sensor Based on a Photonic crystal Fiber Long Period Grating. Instrum Sci Technol (2016) 45(2):181–9. doi:10.1080/10739149.2016.1215994-
27. 李达 何巍, 闫光 祝连庆. Index. 飞秒直写长周期光纤光栅及其液体折射率特性研究 半导体光电 (2017) 38:325–9. doi:10.1016/b978-0-323-37829-1.18001-0
28. Tripathi SM, Bock WJ, Mikulic P. A Wide-Range Temperature Immune Refractive-index Sensor Using Concatenated Long-Period-Fiber-Gratings. Sensors Actuators B: Chem (2017) 243:1109–14. doi:10.1016/j.snb.2016.12.012
29. Zheng Z-M, Yu Y-S, Zhang X-Y, Guo Q, Sun H-B. Femtosecond Laser Inscribed Small-Period Long-Period Fiber Gratings with Dual-Parameter Sensing. IEEE Sensors J (2018) 18:1100–3. doi:10.1109/jsen.2017.2761794
30. 石胜辉 王鑫, 赵明富 吴德操. 罗彬彬: 基于氧化石墨修饰长周期光纤光栅的传感特性 光学精密工程 (2019) 27:2305–14. doi:10.16818/j.issn1001-5868.2020.05.005
32. Guzman-Sepulveda JR, Ruiz-Perez VI, Torres-Cisneros M, Sanchez-Mondragon JJ, May-Arrioja DA. Fiber Optic Sensor for High-Sensitivity Salinity Measurement. IEEE Photon Technol Lett (2013) 25:2323–6. doi:10.1109/lpt.2013.2286132
33. Qi YF, Zhang J, Wang YT, Feng Q, Liu YY. 2018 Asia Communications and Photonics Conference (ACP), Hangzhou, China: Asia Communications and Photonics. (2018). doi:10.1109/acp.2018.8595829 Res refractive index sensor based multi- core micro-nano fiber
34. Liao CR, Wang DN, Wang M, Yang M. Fiber In-Line Michelson Interferometer Tip Sensor Fabricated by Femtosecond Laser. IEEE Photon Technol Lett (2012) 24:2060–3. doi:10.1109/lpt.2012.2219517
35. Zhang Y, Zhou A, Qin B, Deng H, Liu Z, Yang J, et al. Refractive Index Sensing Characteristics of Single-Mode Fiber-Based Modal Interferometers. J Lightwave Technol (2014) 32:1734–40. doi:10.1109/jlt.2014.2311579
36. Li L, Ma Q, Cao M, Zhang G, Zhang Y, Jiang L, et al. High Stability Michelson Refractometer Based on an In-Fiber Interferometer Followed with a Faraday Rotator Mirror. Sensors Actuators B: Chem (2016) 234:674–9. doi:10.1016/j.snb.2016.05.045
37. 苏达顺 马宽明, 孙立朋 武创, 李杰 关柏鸥. 基于大偏置量熔接的反射式光纤型干涉仪的折射率传感特性. 激光与光电子学进展 (2018) 55(631):165–70. doi:10.1163/9789004371507_026
38. Wang A, Xiao H, Wang J, Wang Z, Zhao W, May RG. Self-Calibrated Interferometric – Intensity-Based Optical Fiber Sensors. J Lightwave Technol (2001) 10:1495–501. doi:10.1109/50.956136
39. Ma J, Ju J, Jin L, Jin W. A Compact Fiber-Tip Micro-cavity Sensor for High-Pressure Measurement. IEEE Photon Technol Lett (2011) 23:1561–3. doi:10.1109/lpt.2011.2164060
40. Liu Z, Tse M-LV, Wu C, Chen D, Lu C, Tam H-Y. Intermodal Coupling of Supermodes in a Twin-Core Photonic crystal Fiber and its Application as a Pressure Sensor. Opt Express (2012) 20:21749–57. doi:10.1364/oe.20.021749
43. Yang H, Wang S, Wang X, Wang J, Liao Y. Temperature Sensing in Seawater Based on Microfiber Knot Resonator. Sensors (2014) 14:18515–25. doi:10.3390/s141018515
44. Xin Wang X, Hong-Juan Yang H, Shan-Shan Wang S, Yi-Peng Liao Y, Jing Wang J. Seawater Temperature Measurement Based on a High-Birefringence Elliptic Fiber Sagnac Loop. IEEE Photon Technol Lett (2015) 27:1772–5. doi:10.1109/lpt.2015.2443059
45. Yu Y, Bian Q, Lu Y, Zhang X, Yang J, Liang L. High Sensitivity All Optical Fiber Conductivity-Temperature-Depth (CTD) Sensing Based on an Optical Microfiber Coupler (OMC). J Lightwave Technol (2019) 37:2739–47. doi:10.1109/jlt.2018.2878475
47. Benzi R, Biferale L, Toschi F. Intermittency in Turbulence: Multiplicative Random Process in Space and Time. Roma, Italy: Della Ricerca Scientifica. J Stat Phys (2002) 113, 783.
48. Garabato ACN, Forryan A, Dutrieux P, Brannigan L, Biddle LC, Heywood KJ, et al. Vigorous Lateral export of the Meltwater Outflow from beneath an Antarctic Ice Shelf. Nature (2017) 542:219–22. doi:10.1038/nature20825
49. Bergkvist J, Klawonn I, Whitehouse MJ, Lavik G, Brüchert V, Ploug H. Turbulence Simultaneously Stimulates Small- and Large-Scale CO2 Sequestration by Chain-Forming Diatoms in the Sea. Nat Commun (2018) 9:3046. doi:10.1038/s41467-018-05149-w
50. Takeuchi M, Doubell MJ, Jackson GA, Yukawa M, Sagara Y, Yamazaki H. Turbulence Mediates marine Aggregate Formation and Destruction in the Upper Ocean. Sci Rep (2019) 9:16280–8. doi:10.1038/s41598-019-52470-5
51. Li B, Wei Z, Wang X, Fu Y, Fu Q, Li J, et al. Variability of Coherent and Incoherent Features of Internal Tides in the north South China Sea. Sci Rep (2020) 10:12904. doi:10.1038/s41598-020-68359-7
53. Liu G, Han M, Hou W, Matt S, Goode W, Hou WW, et al. A Miniature Fiber-Optic Sensor for High-Resolution and High-Speed Temperature Sensing in Ocean Environment. SPIE (2015) 94590I. doi:10.1117/12.2180168
Keywords: temperature, salinity, pressure, deep, turbulence, optical fiber sensing
Citation: Wang L, Wang Yj, Song S and Li F (2021) Overview of Fibre Optic Sensing Technology in the Field of Physical Ocean Observation. Front. Phys. 9:745487. doi: 10.3389/fphy.2021.745487
Received: 22 July 2021; Accepted: 13 September 2021;
Published: 20 October 2021.
Edited by:
Kunhua Wen, Guangdong University of Technology, ChinaReviewed by:
M. Mahmood Ali, University of Limerick, IrelandAiran Rodenas, University of La Laguna, Spain
Hongna Zhu, Southwest Jiaotong University, China
Copyright © 2021 Wang, Wang, Song and Li. This is an open-access article distributed under the terms of the Creative Commons Attribution License (CC BY). The use, distribution or reproduction in other forums is permitted, provided the original author(s) and the copyright owner(s) are credited and that the original publication in this journal is cited, in accordance with accepted academic practice. No use, distribution or reproduction is permitted which does not comply with these terms.
*Correspondence: Fang Li, lifang@semi.ac.cn; Sanming Song, songsanming@sia.cn; Yongjie Wang, wyj@semi.ac.cn

 Li Wang
 Yong jie Wang
 Sanming Song1*