iBet uBet web content aggregator. Adding the entire web to your favor.


Link to original content: http://www.ncbi.nlm.nih.gov/pubmed/38951822
Cardiac-derived extracellular vesicles improve mitochondrial function to protect the heart against ischemia/reperfusion injury by delivering ATP5a1 - PubMed Skip to main page content
U.S. flag

An official website of the United States government

Dot gov

The .gov means it’s official.
Federal government websites often end in .gov or .mil. Before sharing sensitive information, make sure you’re on a federal government site.

Https

The site is secure.
The https:// ensures that you are connecting to the official website and that any information you provide is encrypted and transmitted securely.

Access keys NCBI Homepage MyNCBI Homepage Main Content Main Navigation
. 2024 Jul 1;22(1):385.
doi: 10.1186/s12951-024-02618-x.

Cardiac-derived extracellular vesicles improve mitochondrial function to protect the heart against ischemia/reperfusion injury by delivering ATP5a1

Affiliations

Cardiac-derived extracellular vesicles improve mitochondrial function to protect the heart against ischemia/reperfusion injury by delivering ATP5a1

Xuan Liu et al. J Nanobiotechnology. .

Abstract

Background: Numerous studies have confirmed the involvement of extracellular vesicles (EVs) in various physiological processes, including cellular death and tissue damage. Recently, we reported that EVs derived from ischemia-reperfusion heart exacerbate cardiac injury. However, the role of EVs from healthy heart tissue (heart-derived EVs, or cEVs) on myocardial ischemia-reperfusion (MI/R) injury remains unclear.

Results: Here, we demonstrated that intramyocardial administration of cEVs significantly enhanced cardiac function and reduced cardiac damage in murine MI/R injury models. cEVs treatment effectively inhibited ferroptosis and maintained mitochondrial homeostasis in cardiomyocytes subjected to ischemia-reperfusion injury. Further results revealed that cEVs can transfer ATP5a1 into cardiomyocytes, thereby suppressing mitochondrial ROS production, alleviating mitochondrial damage, and inhibiting cardiomyocyte ferroptosis. Knockdown of ATP5a1 abolished the protective effects of cEVs. Furthermore, we found that the majority of cEVs are derived from cardiomyocytes, and ATP5a1 in cEVs primarily originates from cardiomyocytes of the healthy murine heart. Moreover, we demonstrated that adipose-derived stem cells (ADSC)-derived EVs with ATP5a1 overexpression showed much better efficacy on the therapy of MI/R injury compared to control ADSC-derived EVs.

Conclusions: These findings emphasized the protective role of cEVs in cardiac injury and highlighted the therapeutic potential of targeting ATP5a1 as an important approach for managing myocardial damage induced by MI/R injury.

Keywords: ATP5a1; Extracellular vesicles; Ferroptosis; Mitochondria; Myocardial ischemia-reperfusion.


Conflict of interest statement

The authors declare no competing interests.

Figures

None
Graphical Abstract
Fig. 1
Fig. 1
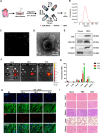
Identification and safety assessment of cEVs. A Schematic diagram showing cEVs isolation by a series of centrifugation steps. B Size distribution for cEVs detected by NTA. C Light scattering microscopy (LSM) images of cEVs. D TEM images of cEVs (scale bar = 50 nm). E Protein markers of cEVs were evaluated by western blot (TSG 101, Alix, CD 9, and Calnexin). F Representative IVIS images of different organs harvested from mice with MI/R injury at 24 h, 48 h, and 72 h after the myocardial injection of DiR-labeled cEVs. Mice that received only cEVs was regarded as negative controls (n = 3 in each group). G Measurement of the fluorescent signal in different organs of mice at 24, 48, and 72 h after the injection of DiR-labeled cEVs (n = 3 in each group). H Representative micrographs of Dil-labelled cEVs (red) in the heart at 24 h, 48 h, and 72 h after intramyocardial injection (scale bar = 50 μm). I H&E staining of major organs (Heart, Liver, Spleen, Lungs, and Kidneys) in mice at day 7 after myocardial injection with PBS or cEVs (scale bar = 100 μm, n = 5 in each group). (Data were expressed as Mean ± SD. (Statistically significant: *p < 0.05, **p < 0.01, and ***p < 0.001 for the fluorescence intensity in 48 h and 72 h vs. 24 h; ###P < 0.001 for the fluorescence intensity in 72 h vs. 48 h)
Fig. 2
Fig. 2
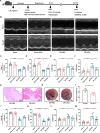
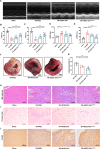
Administration of cEVs protected heart function and ameliorated adverse cardiac remodeling in mice post MI/R injury. A Experimental flow chart for in vivo study. B Representative images of cardiac function at day 3 and day 28 post MI/R determined by M-mode echocardiography (n = 6–8 in each group). C-F Statistical results of echocardiogram illustrated (C) LVEF, (D) LVFS, (E) LVEDV, and (F) LVESV in mice receiving different treatment at day 3 post MI/R (n = 6–8 in each group). G Representative H&E staining of mice heart at day 3 after MI/R injury (scale bar = 200 μm, n = 6 in each group). H, I Representative TTC staining and corresponding analysis showing infarcted area/AAR ratio of mice heart at day 3 after MI/R injury (scale bar = 1 mm, n = 6 in each group). J-M Analysis of LVEF (J), LVFS (K), LVEDV (L), and LVESV (M) in mice at day 28 post MI/R (n = 6–8 in each group). (Data were expressed as Mean ± SD. Statistically significant: *p < 0.05, **p < 0.01, ***p < 0.001, ****p < 0.0001)
Fig. 3
Fig. 3
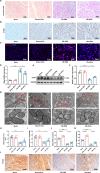
cEVs alleviated ferroptosis and mitochondrial dysfunction in cardiomyocytes under oxidative stress in vivo. A Prussian blue staining showing decreased iron accumulation in mice heart treated with cEVs compared to treated with PBS at day 3 after MI/R (scale bar = 50 μm, n = 6). B Evaluation of 4-HNE accumulation in MI/R mice heart of different groups detected by IHC staining (scale bar = 50 μm, n = 6). C MitoSOX staining indicating mitochondria superoxide production in mice heart (n = 4). D Relative mRNA expression of Ptgs2 in mice heart of different groups detected by RT-qPCR (n = 5). E, F Relative protein expression of GPX4 in mice heart of different groups detected by western blot and corresponding quantification analysis (n = 4). G Representative TEM images showing the mitochondrial morphology in MI/R mice heart (scale bar = 1 μm, n = 5). H, I Mitochondrial area (H) and mitochondrial length/width ratio (I) detected in TEM images. J, K Relative mRNA expression of TFAM (J) and PGC-1α (K) in mice heart of different groups detected by RT-qPCR (n = 5). L Representative micrographs of Tom20 IHC staining in mice heart at day 3 after operation (scale bar = 100 μm, n = 6). (Data were expressed as Mean ± SD. Statistically significant: *p < 0.05, **p < 0.01, ***p < 0.001, ****p < 0.0001)
Fig. 4
Fig. 4
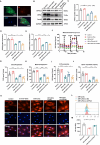
cEVs attenuated oxidative stress-induced cell ferroptosis and mitochondrial dysfunction in vitro. A Schematic diagram showing MCM cells under the H/R model and cEVs treatment. B Representative micrographs showing cEVs uptaken by MCM cells 6 h after coculture. DiL was used to label cEVs, phallodin was used to label microfilament, DAPI was used to label nuclei (scale bar = 100 μm). C Representative micrographs of IF staining showing decreased lipid peroxidation in MCM cells after cEVs treatment (scale bar = 50 μm). D MDA production of MCM cells in different groups (n = 5). E Relative Ptgs2 mRNA expression in MCM cells detected using RT-qPCR (n = 3). F, G Relative GPX4 protein expression in MCM cells detected using western blot and corresponding quantification analysis (n = 3). H JC-1 staining measuring the mitochondrial membrane potential of MCM cells. There were increased hyperpolarization (red) and decreased depolarization (green) of mitochondria in MCM cells following cEVs treatment (scale bar = 50 μm). I, J Relative Tom20 protein expression in MCM cells detected by western blot and corresponding quantification analysis (n = 4). K-M Representative TEM images showing the mitochondrial morphology (K), mitochondrial area (L), and mitochondrial length/width ratio (M) in MCM cells detected in TEM images (scale bar = 1 μm, n = 5). N, O Flow cytometry showing cEVs treatment reduced Mitochondrial ROS content in MCM cells (n = 3). P Representative micrographs of MitoSOX IF staining showing decreased Mitochondrial ROS content in MCM cells after cEVs treatment (scale bar = 50 μm). (Data were expressed as Mean ± SD. Statistically significant: *p < 0.05, **p < 0.01, ***p < 0.001, ****p < 0.0001)
Fig. 5
Fig. 5
ATP5a1 was responsible for cEVs-mediated resistance to oxidative stress damage in cardiomyocytes. A Top 10 of enriched KEGG pathways of top 100 genes from RNA-seq sequencing data of cEVs samples (n = 4). B Top 5 of GO BP, GO MF, and GO CC analysis of top 100 genes from RNA-seq sequencing data of cEVs samples (n = 4). C KEGG chord diagram showing genes corresponding to different enrichment KEGG pathways. On the left is the genes, on the right is the mmu term information of the significant enrichment KEGG pathways. D Validation of RNA-seq sequencing results of cEVs samples detected by RT-qPCR (n = 3). E Relative mRNA expression level of ATP5a1 in MCM cells following siRNA-1, siRNA-2, and siRNA-3 transfection (n = 3). F Relative mRNA expression level of ATP5a1 in MCM cells after transfection of 50nM or 100nM siRNA-1, respectively (n = 3). G Relative mRNA expression level of Ptgs2 in MCM cells of different groups (n = 3). H MDA production in MCM cells (n = 3). I, J Relative protein expression of ATP5a1, GPX4, and Tom20 in different groups detected by western blot and corresponding quantitative analysis (n = 3). K Representative TEM images showing the mitochondrial morphology of MCM cells in different groups. L, M Relative mitochondrial length/width ratio (L) and mitochondrial area (M) detected in TEM images (scale bar = 1 μm, n = 6). N Representative micrographs of MitoSOX IF staining showing Mitochondrial ROS content in MCM cells after different treatment (scale bar = 50 μm). O, P Flow cytometry showing Mitochondrial ROS content in MCM Cells by MitoSOX and corresponding quantification analysis (n = 3). Q JC-1 staining showing the mitochondrial membrane potential of MCM cells in different groups (n = 5). R Mitochondrial oxidative respiration of MCM cells in different groups detected by the cellular OCR. S-V Basal Respiration (S), Maximal Respiration (T), ATP production (U), and Spare Respiratory Capacity (V) of MCM cells in different groups. (Data were expressed as Mean ± SD. Statistically significant: ns: not statistically significant, *p < 0.05, **p < 0.01, ***p < 0.001, ****p < 0.0001)
Fig. 6
Fig. 6
cEVs alleviated H/R induced ferroptosis and mitochondrial damage in NMCMs by transporting ATP5a1. A Representative micrograph showing cEVs uptaken by isolated NMCMs. B Relative protein expression of ATP5a1, GPX4, and Tom20 of NMCMs in different groups detected by western blot (n = 3). C-E Quantitative analysis of protein expression of (C) ATP5a1, (D) GPX4, and (E) Tom20 of NMCMs in different groups (n = 3). F Mitochondrial oxidative respiration of NMCMs in different groups detected by the cellular OCR (n = 6). G-J Basal Respiration (G), Maximal Respiration (H), ATP production (I), and Spare Respiratory Capacity (J) of NMCMs in different groups. K Representative micrographs of MitoSOX IF staining showing Mitochondrial ROS content in NMCMs (scale bar = 50 μm). L, M Flow cytometry detection showing Mitochondrial ROS content in NMCMs revealed by MitoSOX staining and corresponding quantification analysis (n = 3). (Data were expressed as Mean ± SD. Statistically significant: *p < 0.05, **p < 0.01, ***p < 0.001, ****p < 0.0001)
Fig. 7
Fig. 7
Overexpression of ATP5a1in ADSC improved the therapeutic efficacy of ADSC-EVs in murine MI/R models. A Representative image of cardiac function of mice treated with PBS, ADSC-EVs, or ADSC-EVsATP5a1 determined by M-mode echocardiography at day 3 post MI/R operation (n = 6–7). B-E Results of LVEF (B), LVFS (C), LVEDV (D), and LVESV (E) in mice detected by echocardiogram (n = 6–7). F, G Representative TTC staining and corresponding quantification analysis showing infarcted area/AAR ratio of mice heart in different groups (scale bar = 1 mm, n = 5). H Representative H&E staining of mice heart in different groups (scale bar = 100 μm, n = 6). I Representative micrographs of Prussian blue staining showing decreased iron accumulation in mice heart after ADSC-EVsATP5a1 treatment (scale bar = 50 μm, n = 6). J Representative micrographs of Tom20 IHC staining showing alleviated mitochondrial damage in mice heart after ADSC-EVsATP5a1 treatment (scale bar = 100 μm, n = 6). (Data were expressed as Mean ± SD. Statistically significant: *p < 0.05, **p < 0.01, ***p < 0.001, ****p < 0.0001)

Similar articles

Cited by

References

    1. Bulluck H, Yellon DM, Hausenloy DJ. Reducing myocardial infarct size: challenges and future opportunities. Heart. 2016;102(5):341–8. doi: 10.1136/heartjnl-2015-307855. - DOI - PMC - PubMed
    1. Betgem RP, de Waard GA, Nijveldt R, et al. Intramyocardial haemorrhage after acute myocardial infarction. Nat Rev Cardiol. 2015;12(3):156–67. doi: 10.1038/nrcardio.2014.188. - DOI - PubMed
    1. Heusch G, Gersh BJ. The pathophysiology of acute myocardial infarction and strategies of protection beyond reperfusion: a continual challenge. Eur Heart J. 2017;38(11):774–84. - PubMed
    1. Frank A, Bonney M, Bonney S, et al. Myocardial ischemia reperfusion injury: from basic science to clinical bedside. Semin Cardiothorac Vasc Anesth. 2012;16(3):123–32. doi: 10.1177/1089253211436350. - DOI - PMC - PubMed
    1. Hausenloy DJ, Yellon DM. Myocardial ischemia-reperfusion injury: a neglected therapeutic target. J Clin Invest. 2013;123(1):92–100. doi: 10.1172/JCI62874. - DOI - PMC - PubMed

Substances

LinkOut - more resources