iBet uBet web content aggregator. Adding the entire web to your favor.


Link to original content: http://www.ncbi.nlm.nih.gov/pubmed/30150986
The Long Noncoding RNA MALAT1 Induces Tolerogenic Dendritic Cells and Regulatory T Cells via miR155/Dendritic Cell-Specific Intercellular Adhesion Molecule-3 Grabbing Nonintegrin/IL10 Axis - PubMed Skip to main page content
U.S. flag

An official website of the United States government

Dot gov

The .gov means it’s official.
Federal government websites often end in .gov or .mil. Before sharing sensitive information, make sure you’re on a federal government site.

Https

The site is secure.
The https:// ensures that you are connecting to the official website and that any information you provide is encrypted and transmitted securely.

Access keys NCBI Homepage MyNCBI Homepage Main Content Main Navigation
. 2018 Aug 13:9:1847.
doi: 10.3389/fimmu.2018.01847. eCollection 2018.

The Long Noncoding RNA MALAT1 Induces Tolerogenic Dendritic Cells and Regulatory T Cells via miR155/Dendritic Cell-Specific Intercellular Adhesion Molecule-3 Grabbing Nonintegrin/IL10 Axis

Affiliations

The Long Noncoding RNA MALAT1 Induces Tolerogenic Dendritic Cells and Regulatory T Cells via miR155/Dendritic Cell-Specific Intercellular Adhesion Molecule-3 Grabbing Nonintegrin/IL10 Axis

Jian Wu et al. Front Immunol. .

Erratum in

Abstract

By shaping T cell immunity, tolerogenic dendritic cells (tDCs) play critical roles in the induction of immune tolerance after transplantation. However, the role of long noncoding RNAs (lncRNAs) in the function and immune tolerance of dendritic cells (DCs) is largely unknown. Here, we found that the lncRNA MALAT1 is upregulated in the infiltrating cells of tolerized mice with cardiac allografts and activated DCs. Functionally, MALAT1 overexpression favored a switch in DCs toward a tolerant phenotype. Mechanistically, ectopic MALAT1 promoted dendritic cell-specific intercellular adhesion molecule-3 grabbing nonintegrin (DC-SIGN) expression by functioning as an miR155 sponge, which is essential for the tolerogenic maintenance of DCs and the DC-SIGN-positive subset with more potent tolerogenic ability. The adoptive transfer of MALAT1-overexpressing DCs promoted cardiac allograft survival and protected from the development of experimental autoimmune myocarditis, accompanied with increasing antigen-specific regulatory T cells. Therefore, overexpressed MALAT1 induces tDCs and immune tolerance in heart transplantation and autoimmune disease by the miRNA-155/DC-SIGH/IL10 axis. This study highlights that the lncRNA MALAT1 is a novel tolerance regulator in immunity that has important implications in settings in which tDCs are preferred.

Keywords: IL10; MALAT1 long noncoding RNA; dendritic cell-specific intercellular adhesion molecule-3 grabbing nonintegrin; immune tolerance; miR155; tolerogenic dendritic cell.


Figures

Figure 1
Figure 1
MALAT1-activated LPS-stimulated dendritic cells (DCs) transcriptionally regulated by NF-κB. (A) Quantitative real-time reverse transcription PCR (qRT-PCR) was performed to detect MALAT1 expression in DCs stimulated with LPS (10, 200, or 1 µg/ml) at different time points (0, 4, 12, and 24 h). MALAT1 expression was upregulated, reaching peak expression 12 h after LPS stimulation. (B) qRT-PCR analysis of the expression of MALAT1 in DCs stimulated with LPS (200 ng/ml), TNFα (25 ng/ml), the TLR3 agonist lipoteichoic acid (1 mg/ml), or the TLR5 agonist polyinosinic-polycytidylic acid (2 µg/ml) for 24 h (n = 5). MALAT1 levels were upregulated after the application of TNFα, TLR3 ligand, and TLR5 ligand. (C) A ChIP assay was performed with extracts from DCs treated with LPS (200 ng/ml, 12 h) and an antibody against NF-κB p65. The p65 binding site in the promoter region of the IL-8 gene acted as a positive control. The immunoprecipitated DNA was amplified using primers specific for the two predicted p65 binding sites of the MALAT1 promoter. Binding of p65 to both the binding sites at −1537 and at −1037 of the MALAT1 gene following LPS stimulation was increased. (D) qRT-PCR was performed to detect MALAT1 expression in DCs pretreated with or without PDTC (50 µM, 30 min) before LPS stimulation (n = 5). PDTC significantly blocked the LPS-induced increase in MALAT1 levels in LPS-stimulated DCs. (E) MALAT1 expression detected by qRT-PCR in DCs pretreated with or without another inhibitor of IKK2, SC-514 (100 mM). SC-514 significantly blocked the LPS-induced increase in MALAT1 levels in LPS-stimulated DCs. All values of long noncoding RNA (lncRNA) expression levels were normalized to β-actin. The data are presented as the mean ± SD from at least three independent experiments. *P < 0.05.
Figure 2
Figure 2
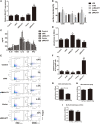
Ectopic MALAT1 favors tolerogenic dendritic cells (tDCs) by inducing T cell hyporesponsiveness and Tregs expansion. Dendritic cells (DCs) were transfected with a MALAT1 pcDNA3.1 vector (pMALAT1, 2.5 µg/ml), a control vector (Vector, 0.625 µg/ml), MALAT1 siRNA (siMALAT1, 100 nM), or siRNA control (siNC, 25 nM) for 6 h before LPS treatment. (A) The expression of MALAT1 was confirmed by quantitative real-time reverse transcription PCR in DCs receiving the different treatments. Expression of MALAT1 was effectively upregulated by pMALAT1, whereas MALAT1 siRNA suppressed MALAT1 expression in DCs. (B) Expression of the costimulatory markers CD80, CD86, and MHCII was analyzed by flow cytometry and is shown as the percentage of CD11c+ cells. MALAT1-suppressed DCs displayed increases in CD80, CD86, and MHCII expression levels compared with those of control DCs treated with LPS. (C) The cytokine secretion levels of IL10, TGFβ, IL12, IFNγ, and IL6 in the DC supernatants were analyzed by ELISA. The induced expression of MALAT1 in LPS-stimulated DCs resulted in reduced levels of IL6, IL12, and IFNγ, whereas levels of IL10 were significantly increased, but no significant effect was observed on TGF-β. (D) DC-triggered T cell proliferation was evaluated by BrdU-ELISA. For this, DCs were treated with mitomycin C (10 mg/ml, 2 h) and cocultured with allogeneic T cells for 48 h at a DC:T cell ratio of 1:20. T cells cocultured with MALAT1-overexpressing DCs exhibited reduced proliferative ability compared with those cocultured with LPS-DCs. (E,F) In the cocultured T cells, the numbers of Tregs (CD4+, CD25+, and Foxp3+) cells were assessed by flow cytometry. Boxes depict gates and numbers correspond to the percentage of cells in each gate. The data are shown with a representative flow cytometry (E) and the percentages (F). The number of Tregs was significantly increased when T cells were cocultured with MALAT1-overexpressing DCs compared with LPS-DCs. (G–I) Tregs (CD4+CD25+) isolated from T cells cocultured with pMALAT1-conditioned DCs by MACS were added into coculture with DCs (from BALB/c, third-party mice or both types ratio of 1:1) and T cells, with a Treg:T cell:DC ratio of 10:10:1. Then, the suppressive ability of the Tregs was assessed by T cell proliferation assays using BrdU-ELISA. Tregs derived from MALAT1-overexpressing DC (from BALB/c mice) cocultures suppressed T cell proliferation in the presence of BALB/c DCs as stimulators but not in the presence of DCs from third-party mice, whereas there was no significant difference in T cell proliferation between both types of LPS-induced DCs. The data are presented as the mean ± SD from at least three independent experiments. *P < 0.05; **P < 0.01. pMALAT1-Treg, Tregs induced by pMALAT1-conditioned DCs in MLRs; No-Treg, without Tregs.
Figure 3
Figure 3
Dendritic cell-specific intercellular adhesion molecule-3 grabbing nonintegrin (DC-SIGN) is essential for the maintenance of MALAT1-conditioned dendritic cell (DC) tolerogenic functions. (A–C) DCs were transfected with siMALAT1 or pMALAT1 for 6 h before LPS stimulation. (A) The expression of DC-SIGN was detected by quantitative real-time reverse transcription PCR (qRT-PCR). The mRNA expression of DC-SIGN was significantly increased in DCs with overexpressed MALAT1 but decreased in those with MALAT1 shRNA compared with control DCs. (B) The level of DC-SIGN was assessed by flow cytometry and shown as percentages. (C) The DC-SIGN expression in DCs was significantly upregulated by MALAT1 overexpression, while MALAT1 downregulation counteracted this effect. (D) The expression of DC-SIGN was detected by qRT-PCR in DCs transfected with siDC-SIGN or the control (25 nM, 6 h). DC-SIGN-targeted shRNA transfection obviously downregulated the expression of DC-SIGN in DCs. (E–K) DCs were pre-incubated with or without shDC-SIGN for 6 h and subsequently cultured with the pMALAT1 vector before LPS stimulation. (E) Expression of the costimulatory markers CD80, CD86, and MHCII was assessed by flow cytometry. In DCs pretreated with the pMALAT1 vector plus DC-SIGN shRNA, the costimulatory molecules were significant increased compared with DCs only treated with the pMALAT1 vector, with no obvious difference compared to control non-treated DCs. (F) The cytokine secretion levels of IL10 in the DC supernatants were analyzed by ELISA. (G) The mRNA expression of IL10 in the DCs was analyzed by qRT-PCR. DC-SIGN knockdown by DC-SIGN shRNA impaired the MALAT1-induced upregulation of IL10 protein and mRNA expression in DCs. (H) The cytokine secretion levels of IL6, IL12, and IFNγ in the DC supernatants were analyzed by ELISA. (I) Allogeneic T cells were cocultured with these DCs and incubated with BrdU (10 mM, 24 h) to quantify T cell proliferation by BrdU-ELISA. Knockdown of DC-SIGN blocked the lower T cell proliferative activity induced by ectopic MALAT1. (J) Flow cytometry assessment of the number of Tregs (CD4+, CD25+, and Foxp3+) in these cocultures, shown as percentages. (K) Knockdown of DC-SIGN blocked the increased Tregs numbers induced by ectopic MALAT1. The data are presented as the mean ± SD from at least three independent experiments.* vs control group, P < 0.05; # vs pMALAT1 group, P < 0.05.
Figure 4
Figure 4
DC-SIGN+ subsets induced by enforced MALAT1 exert a more potent tolerogenic ability. After pMALAT1 transfection and LPS stimulation, dendritic cells (DCs) were sorted by MACS into DC-SIGN+ DCs and DC-SIGN DCs. Then, these DCs were conditioned with mitomycin C (10 mg/ml, 2 h) and cocultured with allogeneic T cells for 48 h. (A) T cell proliferation initiated by DCs was assessed by BrdU-ELISA. DC-SIGN+ DCs exhibited significantly more suppressive effects on primed T cell responses than did LPS-stimulated DCs and DC-SIGN DCs. (B,C) The numbers of Tregs (CD4+CD25+Foxp3+) in T cell cocultures were assessed by flow cytometry (B) and are shown as percentages (C). DC-SIGN+ subsets, but not DC-SIGN subsets, induced the generation of Tregs compared with both LPS-DCs and DC-SIGN DCs. (D) IL10 mRNA expression levels in these isolated Tregs were assessed by quantitative real-time reverse transcription PCR. IL10 mRNA levels in Tregs induced by DC-SIGN+ populations were significantly higher than those in Tregs induced by LPS-DCs or DC-SIGN populations. (E,F) Tregs (CD4+CD25+) isolated from different DC and T cell cocultures by MACS were added to a new coculture of mitomycin C-conditioned DCs (syngeneic or third party) and T cells (Treg:T cell:DC ratio of 10:10:1). The suppressive functions of Tregs on DC-primed T cell responses were assessed by BrdU-ELISA. The DC-SIGN+ subpopulation-induced Tregs, but not those induced by DC-SIGN subsets, showed marked inhibition of DC-primed T cell proliferation. The data are presented as the mean ± SD from at least three independent experiments. *P < 0.05; **P < 0.01.
Figure 5
Figure 5
MALAT1 promotes dendritic cell-specific intercellular adhesion molecule-3 grabbing nonintegrin (DC-SIGN) expression by functioning as an miR155-5p sponge. (A) MALAT1 expression levels were measured by quantitative real-time reverse transcription PCR (qRT-PCR) in nuclear and cytosolic extracts of LPS-stimulated dendritic cells (DCs). The cytosol and nuclear markers used were GAPDH and U6. (B) RNA-FISH was performed to detect MALAT1 expression in LPS-stimulated DCs. Nuclei, blue; MALAT1, red. MALAT1 was in both the nucleus and cytoplasm of DCs. (C,D) Total cellular fractions were isolated from LPS-stimulated DCs and immunoprecipitated using Ago2 or IgG antibodies in RNA immunoprecipitation assays. MALAT1 and miR155 levels in the immunoprecipitated complex were detected by qRT-PCR. Significant enrichment of MALAT1 was observed in Ago2 immunoprecipitates compared with that in IgG control immunoprecipitates. miR155 was observed in Ago2 immunoprecipitates and compared with that in IgG control immunoprecipitates. (E) The miR155 levels were detected by qRT-PCR in DCs transfected with siMALAT1 or pMALAT1 before LPS stimulation. miR-155 was upregulated in the shMALAT1-treated DCs. (F) Schematic illustration of the three miR-155 targeting sites on the MALAT1 gene, WT1(4467–91), WT2(5031–51), and WT3(5375–98). The created mutations (Mut1, Mut2, and Mut3) are shown corresponding to each wild-type (WT), respectively. (G) Luciferase reporters containing one of three WT or one of three corresponding mutant putative miR155 binding sites in MALAT1 were constructed. DCs were infected with or without miR-155 mimics and then transfected with luciferase constructs of WT1, WT2, WT3, Mut1, Mut2, or Mut3, respectively. Luciferase activity was analyzed 48 h after transfection. (H–J) DCs were transfected with siMALAT1, pMALAT1, or the combination of pMALAT1 and miR155 mimics before LPS stimulation. PU.1 and DC-SIGN protein levels were detected by western blot (H). MALAT1 knockdown significantly decreased PU.1 and DC-SIGN levels in DCs, and MALAT1 overexpression significantly increased PU.1 and DC-SIGN levels compared with those in the control group. Treatment with miR155 mimics partially abolished the effects of MALAT1 on PU.1 and DC-SIGN levels. (K,L) DCs were transfected with pMALAT1 or the combination of pMALAT1 and miR155 mimics before LPS stimulation, and DC-SIGN expression levels in DCs were also assessed by flow cytometry (K) and shown as percentages (L). The data are presented as the mean ± SD from at least three independent experiments. *P < 0.05; **P < 0.01.
Figure 6
Figure 6
Adoptive transfer of MALAT1-overexpressing dendritic cells (DCs) protected mice from acute transplant rejection and induced Tregs expression. Transplant-recipient mice were transfused with phosphate-buffered saline (PBS), LPS-stimulated DCs, MALAT1-overexpressing DCs (pMALAT1-DCs), or sorted DC-SIGN+ cells from MALAT1-overexpressing DCs (pMALAT1+DC-SIGN+) before transplantation or oral treatment with 1 mg/kg/day of tacrolimus for 7 days. (A) Graft survival times of recipients. Abbreviation: MST, median survival time. The survival times in the groups were compared using Mann–Whitney U testing. Transfusion with MALAT1-overexpressing DCs or DC-SIGN+ DC populations significantly prolonged cardiac allograft survival compared with LPS-DC and PBS transfusion. (B) Histologic studies of cardiac allografts harvested 7 days after transplantation were stained with hematoxylin and eosin (H&E) (left) and immunohistochemically stained for Foxp3 (right) [(B), original magnification 20×]. (C) Assessment of H&E staining by grading according to the 2005 classification of the International Society for Heart and Lung Transplantation for acute cellular rejection. (D) Cell counts of infiltrating Foxp3+ cells in cardiac allografts from each group 7 days post-transplantation by immunohistochemical staining. Cardiac allografts from recipients transfused with MALAT1-overexpressing DCs and DC-SIGN+ subpopulations had more Foxp3-positive staining cells than did those from recipients transfused with LPS-DC and PBS. The data indicate mean ± SD values derived from five samples in each group and were compared using analysis of variance with the Ryan method. (E,F) Tregs (CD4+CD25+ Foxp3+) in splenic T cells were assessed by flow cytometry (E) and are shown as percentages (F). Treg numbers were significantly elevated in the spleens of recipient mice injected with pMALAT1-DCs or pMALAT1-DC-SIGN+ DCs. Filled histograms represent isotype-matched irrelevant specificity controls. (G,H) Tregs (CD4+CD25+) isolated from recipients transfused with pMALAT1-conditioned DCs by MACS were added to cocultures with mitomycin C-treated splenic cells (from BALB/c mice or third-party mice) and T cells. The suppressive ability of Tregs was assessed by T cell proliferation using BrdU-ELISA. Tregs significantly decreased T cell proliferation when cocultured with donor splenic cells, but not when cocultured with third-party splenic cells. (I) Splenic T cells were separated from recipient mice at day 7 post-transplantation. The proliferating activity of splenic T cells was assessed by BrdU-ELISA. In the recipients transfused with pMALAT1-DCs or pMALAT1-DC-SIGN+ DCs, splenic T cell proliferation was significantly suppressed. (J) IL10, IL12, and IL6 concentrations in the sera of recipient mice were measured by ELISA. The IL12 and IL6 in serum were significantly decreased and IL10 was significantly increased in mice transfused with pMALAT1-DCs or pMALAT1-DC-SIGN+ DCs. The data are presented as the mean ± SD from at least five independent experiments. *P < 0.05; **P < 0.01. pMALAT1-DCs, MALAT1-overexpressing DCs; pMALAT1+DC-SIGN+, DC-SIGN+ subsets from MALAT1-overexpressing DCs.
Figure 7
Figure 7
In vivo transfer of MALAT1-overexpressing dendritic cells (DCs) deferred autoimmune myocarditis progression. After induction of experimental autoimmune myocarditis (EAM) (immunization with α-myosin H-chain peptide), mice were transfused with MALAT1-overexpressing DCs, LPS-DC, or phosphate-buffered saline (PBS), respectively. Hearts were collected on day 21 post-immunization. (A) Consecutive cardiac sections were stained with hematoxylin and eosin (H&E) (original magnification 20×). (B) Analysis of H&E staining by grading as described in Section “Materials and Methods.” Transfusion with MALAT1-overexpressing DCs significantly alleviated acute myocardial inflammation in EAM mice compared with PBS transfusion. (C–E) Myocardial function was evaluated by echocardiography (C) on day 42 post-immunization, and the parameters of LVEDDs (E) and EF (D) were as shown. Animals injected with MALAT1-overexpressing DCs showed less LV and LVEDDs and more EF than did those that received LPS-DCs and PBS transfusion. (F–I) Splenic T cells were separated from EAM mice at day 21 post-immunization. (F) IL10, IL12, and IL6 production in the serum of EAM mice was detected by ELISA. The expressions of IL12 and IL6 were significantly decreased and that of IL10 was increased in mice injected with pMALAT1-DCs. (G) BrdU-ELISA determined the proliferating activity of splenic T cells. (H,I) Tregs (CD4+CD25+Foxp3+) in splenic T cells were assessed by flow cytometry (H) and are shown as percentages (I). Filled histograms represent isotype-matched irrelevant specificity controls. The data are presented as the mean ± SD from at least three independent experiments. *P < 0.05; **P < 0.01.

Similar articles

Cited by

References

    1. Iberg CA, Jones A, Hawiger D. Dendritic cells as inducers of peripheral tolerance. Trends Immunol (2017) 38(11):793–804.10.1016/j.it.2017.07.007 - DOI - PMC - PubMed
    1. Worbs T, Hammerschmidt SI, Forster R. Dendritic cell migration in health and disease. Nat Rev Immunol (2017) 17(1):30–48.10.1038/nri.2016.116 - DOI - PubMed
    1. Osorio F, Fuentes C, Lopez MN, Salazar-Onfray F, Gonzalez FE. Role of dendritic cells in the induction of lymphocyte tolerance. Front Immunol (2015) 6:535.10.3389/fimmu.2015.00535 - DOI - PMC - PubMed
    1. Hongo D, Tang X, Zhang X, Engleman EG, Strober S. Tolerogenic interactions between CD8+ dendritic cells and NKT cells prevent rejection of bone marrow and organ grafts. Blood (2017) 129(12):1718–28.10.1182/blood-2016-07-723015 - DOI - PMC - PubMed
    1. Zhou Y, Shan J, Guo Y, Li S, Long D, Li Y, et al. Effects of adoptive transfer of tolerogenic dendritic cells on allograft survival in organ transplantation models: an overview of systematic reviews. J Immunol Res (2016) 2016:5730674.10.1155/2016/5730674 - DOI - PMC - PubMed

Publication types

MeSH terms