iBet uBet web content aggregator. Adding the entire web to your favor.


Link to original content: http://www.ncbi.nlm.nih.gov/pubmed/28630303
How members of the human gut microbiota overcome the sulfation problem posed by glycosaminoglycans - PubMed Skip to main page content
U.S. flag

An official website of the United States government

Dot gov

The .gov means it’s official.
Federal government websites often end in .gov or .mil. Before sharing sensitive information, make sure you’re on a federal government site.

Https

The site is secure.
The https:// ensures that you are connecting to the official website and that any information you provide is encrypted and transmitted securely.

Access keys NCBI Homepage MyNCBI Homepage Main Content Main Navigation
. 2017 Jul 3;114(27):7037-7042.
doi: 10.1073/pnas.1704367114. Epub 2017 Jun 19.

How members of the human gut microbiota overcome the sulfation problem posed by glycosaminoglycans

Affiliations

How members of the human gut microbiota overcome the sulfation problem posed by glycosaminoglycans

Alan Cartmell et al. Proc Natl Acad Sci U S A. .

Abstract

The human microbiota, which plays an important role in health and disease, uses complex carbohydrates as a major source of nutrients. Utilization hierarchy indicates that the host glycosaminoglycans heparin (Hep) and heparan sulfate (HS) are high-priority carbohydrates for Bacteroides thetaiotaomicron, a prominent member of the human microbiota. The sulfation patterns of these glycosaminoglycans are highly variable, which presents a significant enzymatic challenge to the polysaccharide lyases and sulfatases that mediate degradation. It is possible that the bacterium recruits lyases with highly plastic specificities and expresses a repertoire of enzymes that target substructures of the glycosaminoglycans with variable sulfation or that the glycans are desulfated before cleavage by the lyases. To distinguish between these mechanisms, the components of the B. thetaiotaomicron Hep/HS degrading apparatus were analyzed. The data showed that the bacterium expressed a single-surface endo-acting lyase that cleaved HS, reflecting its higher molecular weight compared with Hep. Both Hep and HS oligosaccharides imported into the periplasm were degraded by a repertoire of lyases, with each enzyme displaying specificity for substructures within these glycosaminoglycans that display a different degree of sulfation. Furthermore, the crystal structures of a key surface glycan binding protein, which is able to bind both Hep and HS, and periplasmic sulfatases reveal the major specificity determinants for these proteins. The locus described here is highly conserved within the human gut Bacteroides, indicating that the model developed is of generic relevance to this important microbial community.

Keywords: Bacteroides thetaiotaomicron; glycosaminoglycan degradation; heparan sulfate; heparin; human gut microbiota.


Conflict of interest statement

The authors declare no conflict of interest.

Figures
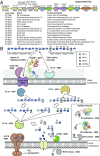
Fig. 1.
Fig. 1.
Model for degradation of Hep and HS by Bt. (A) Schematic of the PULHep locus in Bt. IM, inner membrane. (B) Schematic representation of the cellular location, activity, and specificity of the PULHep-encoded enzymes and glycan binding proteins. A typical HS structure is shown. The proteins for which X-ray crystallographic structures were determined in this work are represented by thumbnail images of the structure.
Fig. S1.
Fig. S1.
Growth of WT and mutant strains of Bt on Hep, HS, and ΔSHep. (A) Mutant strains with deletions in PULHep glycan-binding proteins BT4661 and BT4659. Left, Inset shows growth on heparin oligosaccharides. (B) BT4662 PL12 single- and BT4662 PL12/BT4652 PL15 double-mutant strains. (C) BT4652 PL15 mutant strain. (D) BT4657 PL12 single- and BT4657/BT4652 PL15 double-mutant strains. (E) BT4675 PL13 single- and BT4675 PL13/BT4652 PL 15 double-mutant strains. (F) BT4655 NS sulfatase and BT4654 GlcNAc kinase mutant strains. All growths were performed in MM supplemented with 10 mg/mL appropriate polysaccharide. OD600 measurements were taken every 20 min after bacterial inoculation using a plate reader.
Fig. S2.
Fig. S2.
PULHep distribution and synteny. Genes are represented above or under the scaffold (bold line) to distinguish the coding strain. High distance between the left-most PL13-coding gene, separated by 5–20 genes from the main PUL region, is depicted by a double slash interrupting the scaffolds. Homologous proteins across species with similar PUL modular arrangement are connected by gray trapezoids. Species names are indicated on the right. PUL 1 and 2 are used to indicate discrete but similar PULs within the same species.
Fig. S3.
Fig. S3.
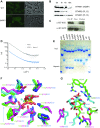
Cellular localization of proteins encoded by PULHep, SAXS curves, and key binding residues of BT4661SGBP and comparison of the active sites of the sulfatases with structural homologs. (A) Immunofluorescence labeling of Glc-grown WT or ∆BT4661 cells with (Left) anti-4661 antibody or (Right) phase contrast. (B) Western blots showing Hep-grown whole cells treated with proteinase K and probed with polyclonal antibodies raised against recombinant forms of BT4661SGBP, BT4662PL12, and BT4657PL12. Proteinase K cannot cross the outer membrane and therefore, can only act on surface-located proteins, revealing that BT4661SGBP and BT4662PL12 are surface-located, whereas BT4657PL12 is most likely periplasmic. (C) Co-IP of BT4661SGBP and BT4659SusD-like from lysate of Hep-grown cells using anti-BT4461 polyclonal antibody immobilized to agarose beads. IP, immunoprecipitation. (D) Experimental SAXS curves and the fitted scattering profiles calculated by GASBOR. Experimental merged data are shown as gray triangles (liganded BT4661SGBP) or blue circles (apo BT4661SGBP). The scattering curves fitted with GASBOR are shown as solid lines. lnl, logarithmic representation of intensity; q, scattering angle in angstroms−1. (E) Affinity gel electrophoresis of BT4661SGBP alanine mutants of residues that interact with the fully sulfated Hep-derived hexasaccharide ligand. Upper shows native gel with no added ligand, and Lower shows native gel with added Hep (0.1% final). Loss of retardation of K505A, R581A, and R582A on the Hep gel reveals that these residues are critical in ligand recognition. (F) Overlay of BT46566S-sulf (green), human galactosamine-6-sulfatase (PDB ID code 4FDI; magenta), and BT15962S-sulf (cyan), showing the conservation in the catalytic center. The sulfate groups shown are bound to BT46566S-sulf and BT15962S-sulf, whereas the calcium ions are bound to BT46566S-sulf and 4FDI. Note that residue 89 in 4FDI is formyl glycine (FG). (G) Overlay of BT46566S-sulf with GlcNS6S bound (green), 4FDI (magenta), and BT15962S-sulf with 4,5UA2S-GlcNS6S bound (cyan), showing variability in the glycone binding region. For clarity, only the sugar interacting with the protein has been shown.
Fig. 2.
Fig. 2.
Structural and biochemical characterization of the PULHep-encoded SGBP BT4661. (A) ITC traces for (Upper) BT4661SGBP and (Lower) BT4659SusD-like against HS and Hep. (B) Cartoon representation of BT4661SGBP colored from blue to red from the N terminus to the C terminus. Each of six discrete domains is labeled. Gray spheres show the positions of the interdomain prolines. (C) SAXS envelopes (gray mesh) for (Upper) apoBT4661SGBP and (Lower) BT4661SGBP + Hep. The best fit of the crystal structure of BT4661SGBP (colored from blue to red from the N terminus to the C terminus) is shown inside the SAXS envelopes. (D) 2Fo-Fc map contoured at 1.0 sigma for fully sulfated Hep-derived hexasaccharide in complex with BT4661SGBP. (E) Structure of D5 and D6 C-terminal domains of BT4661SGBP bound to Hep hexasaccharide (carbons as yellow sticks). (F) Ligand binding site of BT4661SGBP bound to fully sulfated Hep hexasaccharide. Amino acid side chains are shown in green, the sugars are in yellow, and H bonds between the ligand and protein are black dotted lines. The residues labeled in red are critical for ligand recognition. The six sugar binding subsites are labeled one to six from the reducing end of the oligosaccharide.
Fig. 3.
Fig. 3.
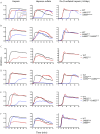
Product profile of the PULHep-encoded PLs against Hep, HS, and ΔSHep. (A) BT4662, (B) BT4657, (C) BT4675, and (D) BT4652. Peaks were identified by comparison with known standards at A235. Black lines represent zero time points, whereas blue, green, and red lines represent early, middle, and late points, respectively, in the reaction time course for each enzyme.
Fig. S4.
Fig. S4.
Activity of whole cells and recombinant PULHep enzymes against Hep and Hep oligosaccharides and evidence that BT4655 is a sulfaminidase. (A) Activity of whole cells and recombinant lysases (0.1 μM) against Hep (10 mg/mL). Top shows cells grown on Glc or Hep as the sole carbon source to midexponential phase, washed, and assayed against Hep to determine surface enzyme activity. Middle and Bottom are products released by recombinant forms of the different PUL-encoded lyases against Hep. Di and Tet are Hep disaccharide and tetrasaccharide standards, respectively (structures 2 and 5, respectively, in B). (B) Identity of the sugars labeled in C and D. (C) Chromatograms showing sulfate tolerances of BT4657PL12 against 4, a sulfated tetrasaccharide lacking a single O2 sulfation, and 5, a fully sulfated tetrasaccharide, pre- and postaddition of BT15962S-sulf. (D) Chromatograms showing exoprocessivity of BT4652PL15 against Hep oligosaccharides (all at 50 µM substrate). (E) TLC analysis of BT4662PL12 and BT4657PL12 product profiles against ΔSHep (10 mg/mL). (F) Supernatants of stationary-phase WT and ΔBT4655NS-Sulf cells grown on Hep. GlcNS lane is a standard.
Fig. 4.
Fig. 4.
Sulfatase structures. Upper shows cartoon representations of (A) BT15962S-sulf and (B) BT46566S-sulf. 2Fo-Fc maps contoured at 1.0 sigma for Δ4,5UA2Sβ1–4GlcNS6S in complex with BT15962S-sulf and GlcNS6S in complex with BT46566S-sulf are shown in the respective enzymes active sites. Lower shows stick representations of the active site interactions between (A) BT15962S-sulf and Δ4,5UA2Sβ1–4GlcNS6S and (B) BT46566S-sulf and GlcNS6S. Amino acid side chains are shown in green, the sugars are in yellow, and H bonds between the sugar and protein are black dotted lines. Residues labeled in red are the key catalytic amino acids.

Similar articles

Cited by

References

    1. Kau AL, Ahern PP, Griffin NW, Goodman AL, Gordon JI. Human nutrition, the gut microbiome and the immune system. Nature. 2011;474:327–336. - PMC - PubMed
    1. Round JL, Mazmanian SK. The gut microbiota shapes intestinal immune responses during health and disease. Nat Rev Immunol. 2009;9:313–323. - PMC - PubMed
    1. Bäckhed F, Ley RE, Sonnenburg JL, Peterson DA, Gordon JI. Host-bacterial mutualism in the human intestine. Science. 2005;307:1915–1920. - PubMed
    1. Koropatkin NM, Cameron EA, Martens EC. How glycan metabolism shapes the human gut microbiota. Nat Rev Microbiol. 2012;10:323–335. - PMC - PubMed
    1. Rogowski A, et al. Glycan complexity dictates microbial resource allocation in the large intestine. Nat Commun. 2015;6:7481. - PMC - PubMed

Publication types

MeSH terms

LinkOut - more resources