iBet uBet web content aggregator. Adding the entire web to your favor.


Link to original content: http://www.ncbi.nlm.nih.gov/pubmed/28270506
Biochemical and structural analyses of a bacterial endo-β-1,2-glucanase reveal a new glycoside hydrolase family - PubMed Skip to main page content
U.S. flag

An official website of the United States government

Dot gov

The .gov means it’s official.
Federal government websites often end in .gov or .mil. Before sharing sensitive information, make sure you’re on a federal government site.

Https

The site is secure.
The https:// ensures that you are connecting to the official website and that any information you provide is encrypted and transmitted securely.

Access keys NCBI Homepage MyNCBI Homepage Main Content Main Navigation
. 2017 May 5;292(18):7487-7506.
doi: 10.1074/jbc.M116.762724. Epub 2017 Mar 7.

Biochemical and structural analyses of a bacterial endo-β-1,2-glucanase reveal a new glycoside hydrolase family

Affiliations

Biochemical and structural analyses of a bacterial endo-β-1,2-glucanase reveal a new glycoside hydrolase family

Koichi Abe et al. J Biol Chem. .

Abstract

β-1,2-Glucan is an extracellular cyclic or linear polysaccharide from Gram-negative bacteria, with important roles in infection and symbiosis. Despite β-1,2-glucan's importance in bacterial persistence and pathogenesis, only a few reports exist on enzymes acting on both cyclic and linear β-1,2-glucan. To this end, we purified an endo-β-1,2-glucanase to homogeneity from cell extracts of the environmental species Chitinophaga arvensicola, and an endo-β-1,2-glucanase candidate gene (Cpin_6279) was cloned from the related species Chitinophaga pinensis The Cpin_6279 protein specifically hydrolyzed linear β-1,2-glucan with polymerization degrees of ≥5 and a cyclic counterpart, indicating that Cpin_6279 is an endo-β-1,2-glucananase. Stereochemical analysis demonstrated that the Cpin_6279-catalyzed reaction proceeds via an inverting mechanism. Cpin_6279 exhibited no significant sequence similarity with known glycoside hydrolases (GHs), and thus the enzyme defines a novel GH family, GH144. The crystal structures of the ligand-free and complex forms of Cpin_6279 with glucose (Glc) and sophorotriose (Glc-β-1,2-Glc-β-1,2-Glc) determined up to 1.7 Å revealed that it has a large cavity appropriate for polysaccharide degradation and adopts an (α/α)6-fold slightly similar to that of GH family 15 and 8 enzymes. Mutational analysis indicated that some of the highly conserved acidic residues in the active site are important for catalysis, and the Cpin_6279 active-site architecture provided insights into the substrate recognition by the enzyme. The biochemical characterization and crystal structure of this novel GH may enable discovery of other β-1,2-glucanases and represent a critical advance toward elucidating structure-function relationships of GH enzymes.

Keywords: Chitinophaga pinensis; Gram-negative bacteria; endo-β-1,2-glucanase; enzyme structure; glycosidase; novel glycoside hydrolase family; oligosaccharide; polysaccharide; sophorooligosaccharide; β-1,2-glucan.


Conflict of interest statement

The authors declare that they have no conflicts of interest with the contents of this article

Figures

Figure 1.
Figure 1.
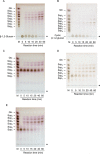
TLC analysis of β-1,2-glucan-hydrolyzing activity of C. arvensicola and C. pinensis. A, C. pinensis (culture filtrates). B, C. arvensicola (culture filtrates and cell extracts). Culture filtrates and cell extracts (30 μl) were mixed with the same volume of 1% (w/v) β-1,2-glucan (average DP 64) and then incubated at 25 °C. An aliquot of each mixture was spotted onto a TLC plate. Lane M contains markers (1 μl of 0.2% each sugar). C, TLC analysis of β-glucosidase inhibition by GDL. A reaction mixture (20 μl) containing 12.5% (v/v) cell extract of C. arvensicola, 0.5% (w/v) β-1,2-glucan, 100 mm MOPS-NaOH buffer (pH 6.5), and 20–50 mm GDL was incubated at 30 °C for 2 days, and then each reaction mixture was spotted onto a TLC plate. Lanes M1 and M2 contain markers (M1, 1 μl of 0.2% each sugar; M2, 1 μl of 20 mm GDL). The asterisk indicates the origin on the TLC plate.
Figure 2.
Figure 2.
Purification of endo-β-1,2-glucanase from a C. arvensicola cell extract. A, fractionated proteins were subjected to SDS-PAGE, followed by silver staining (bottom), and then the enzymatic activity was measured (top). Lane M contains protein standard markers. Endo-β-1,2-glucanase activity was evaluated as the ratio of β-1,2-glucan-hydrolyzing activity to β-glucosidase activity. The enzymatic reaction was conducted in a mixture (50 μl) containing 80% (v/v) enzyme fraction, 0.2% (w/v) β-1,2-glucan (average DP 64), and 50 mm MOPS-NaOH buffer (pH 6.5) at 30 °C for 16 h. An aliquot of the reaction mixture (40 μl) was mixed with 160 μl of a 1% (w/v) PAHBAH-HCl solution and then heated at 100 °C for 5 min, followed by measurement of absorbance at 405 nm. The arrow indicates the protein band subjected to N-terminal amino acid sequence analysis. B, TLC analysis of endo-β-1,2-glucanase in fraction 9. The enzymatic reaction was carried out in a mixture (10 μl) containing 85% (v/v) fraction 9 concentrated using Amicon Ultra 30,000 molecular weight cutoff (Millipore), 0.2% (w/v) β-1,2-glucan (average DP 64), and 50 mm MOPS-NaOH buffer (pH 6.5) at 30 °C for 16 h, and then an aliquot of the mixture was spotted onto a TLC plate. Lane M contains markers (1 μl of 0.2% (w/v) each sugar). The asterisk indicates the origin on the TLC plate. Minus and plus indicate whether fraction 9 was added to the reaction mixture or not.
Figure 3.
Figure 3.
SDS-PAGE analysis of Cpin_6279rC (A) and TLC analysis of β-1,2-glucan-degrading activity of Cpin_6279rC (B). A, SDS-PAGE of the purified Cpin_6279rC. Lane M contains protein standard markers. B, lane M contains markers (1 μl of 0.2% each sugar). The enzymatic reaction was conducted in a reaction mixture (50 μl) containing various concentrations of Cpin_6279rC, 0.2% (w/v) β-1,2-glucan (average DP 64), and 50 mm MOPS-NaOH buffer (pH 6.5) at 30 °C for 10 min. The asterisk indicates the origin on the TLC plate.
Figure 4.
Figure 4.
pH (A) and temperature (B) profiles of Cpin_6279rC. The stability (dashed line) and optimum (solid line) are shown. A, buffers used for incubation and enzymatic reaction were sodium citrate (pH 3.0–5.5, closed circles), MES-NaOH (pH 5.5–6.5, open circles), MOPS-NaOH (pH 6.5–7.5, closed triangles), 2-hydroxy-3-[4-(2-hydroxyethyl)-1-piperazinyl]propanesulfonic acid-NaOH (pH 7.5–8.5, open triangles), and glycine-NaOH (pH 8.6–10, closed rhombi). The highest activity was defined as 100% (stability, pH 6.5; and optimum, pH 6.0). B, highest activity was defined as 100% (50 °C). As for the enzymatic reaction at 60 and 70 °C, the data from 0 to 1.5 min were used to calculate the initial velocity.
Figure 5.
Figure 5.
TLC analysis of the action patterns of Cpin_6279rC on β-1,2-glucan and Sopns. β-1,2-Glucan (average DP 64) (A), cyclic β-1,2-glucan (DP 17–24) (B), Sop5 (C), Sop6 (D), and Sop7 (E) were used as substrates. Lane M contains markers (0.2% each sugar). Asterisks represent the origins of the TLC plates.
Figure 6.
Figure 6.
HPLC analysis of the action patterns of Cpin_6279rC on Sopns. A, reference chromatogram of 2 mm Sop2–5. B–D, monitoring of the reaction products derived from Sop5 (B), Sop6 (C), and Sop7 (D). The solid line represents the sample before incubation with Cpin_6279rC. The dotted and dashed lines represent the samples after incubation with Cpin_6279rC for 5 and 10 min, respectively.
Figure 7.
Figure 7.
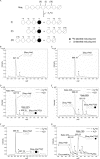
Mass spectra of the reaction products from Sop7 hydrolyzed by Cpin_6279rC in 18O-labeled water. A, hydrolysis patterns of Cpin_6279rC as to Sop7 observed in D–G. Each reducing end is indicated by a slanting line. The numbers above schematic diagrams of oligosaccharides represent subsites. The numbers in parentheses indicate minor subsites. B and C, reference spectra of Sop3 and Sop4. D–G, enlarged views of mass spectra of Sop3 (D), Sop4 (E), Sop2 (F), and Sop5 (G) produced by enzymatic hydrolysis of Sop7. Solid and dashed lines show the spectra of the reaction products in the presence and absence of 18O-labeled water, respectively. The values above the peaks represent the molecular weights of the reaction products when using H218O. The asterisks denote the peaks derived from natural 13C-containing oligosaccharides. Schematic diagrams in parentheses represent the minor products.
Figure 8.
Figure 8.
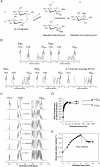
1H NMR spectra and polarimetric analysis of the Cpin_6279rC-catalyzed reaction. A, schematic representation of hydrolysis catalyzed by Cpin_6279rC. −1 and +1 denote subsites. H1α and H1β represent anomeric equatorial and axial protons at the reducing end of the reaction product, respectively. H2NR represents the C2 proton at the non-reducing end of the reaction product. B, reference spectra of Sop2–5 and β-1,2-glucan (average DP 25). C, 1H NMR time course analysis of the reaction products. H1α and H2NR represent the resonance signals corresponding to A. D, time course of the ratio of peak area to internal standard. The ratios of the peak areas of H1α and H2NR to the internal standard are represented by closed triangles and closed circles, respectively. E, time course of observed optical rotation during β-1,2-glucan-hydrolysis by Cpin_6279rC. The arrow indicates the time of the addition of a droplet of an ammonia solution (6 min). β-1,2-Glucan (average DP25) was used as a substrate.
Figure 9.
Figure 9.
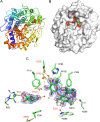
Crystal structure of Cpin_6279rN. The bound ligands are shown as green sticks. A, schematic representation of the overall structure of Cpin_6279rN complexed with Sop3 and Glc. The structure is color-ramped from the N terminus (blue) to the C terminus (red). B, surface representation of the Cpin_6279rN structure. The highly conserved catalytic residue candidates (Glu-54, Asp-135, Asp-139, Glu-142, Glu-211, and Asp-400) are colored red. C, active-site architecture. Amino acid side chains engaged in the ligand recognition are represented by gray sticks (ligand-free) and green sticks (Sop3-Glc complex). The candidate catalytic residues are given in red. The water molecules are represented as red spheres. Hydrogen bonds are represented by yellow dashed lines. The σA-weighted mFoDFc omit electron density map of the ligands is shown as a blue mesh (contoured at 2.5 σ).
Figure 10.
Figure 10.
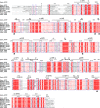
Sequence alignment of Cpin_6279 and its homologs. Multiple sequence alignment was performed with Clustal Omega (55). Identical amino acids are highlighted in red, and conservative residues are boxed. Helices (α), strands (β), and 310 helices (η) are denoted above the alignment. Letters in parentheses correspond to the secondary structural elements shown in Fig. 9A. The residues corresponding to highly conserved acidic amino acids in the active site are indicated by solid stars. The GenBankTM accession numbers of the proteins used for the alignment are as follows: Cpin_6279 (ACU63684.1); BF9343_0330 (CAH06109.1); BACCAC_03554 (EDM19439.1); BACUNI_03963 (EDO52350.1); BT_3566 (AAO78672.1); Bovatus_03682 (ALJ48288.1); Fjoh_3523 (ABQ06537.1); and Dfer_4452 (ACT95653.1). The figure was prepared with ESPript (56).
Figure 11.
Figure 11.
Phylogenetic tree of a novel GH family. Sequences for phylogenetic analysis were retrieved for each genus in the KEGG database and confined to one paralog per species. After multiple sequence alignment using MUSCLE had been performed (57), a phylogenetic tree was constructed using MEGA7 (58) based on the neighbor-joining method. Species harboring the gene of a Cpin_6279 homolog are categorized into phyla and surrounded by solid lines. The organism possessing the gene cloned in this study is shown with a black background and white letters. Cpin_6279 is denoted by a closed circle.
Figure 12.
Figure 12.
Structural comparison with other GH family enzymes. The α-helices are colored cyan. Catalytic residues (GH15 and GH8) and strictly conserved amino acids in the active site of Cpin_6279 are colored magenta and shown as a stick model. A, overall structure of Cpin_6279rN. Glu-54, Asp-135, Asp-139, Glu-142, Glu-211, and Asp-400 are strictly conserved residues. Glu-54 is located between α1 and α2. Asp-135, Asp-139, and Glu-142 are located between α3 and α4. Glu-211 is located between α5 and α6. Asp-400 is located between α11 and α12. B, overall structure of GH15 glucoamylase (PDB code 1AGM). Glu-179 (catalytic acid) is located between α5 and α6. Glu-400 (catalytic base) is located between α11 and α12. C, overall structure of GH8 endoglucanase (PDB code 1KWF). Glu-95 (mutated to Gln-95, catalytic acid) is located between α1 and α2. Glu-278 (catalytic base) is located between α7 and α8.

Similar articles

Cited by

References

    1. Henrissat B. (1991) A classification of glycosyl hydrolases based on amino acid sequence similarities. Biochem. J. 280, 309–316 - PMC - PubMed
    1. Henrissat B., and Bairoch A. (1993) New families in the classification of glycosyl hydrolases based on amino acid sequence similarities. Biochem. J. 293, 781–788 - PMC - PubMed
    1. Henrissat B., and Bairoch A. (1996) Updating the sequence-based classification of glycosyl hydrolases. Biochem. J. 316, 695–696 - PMC - PubMed
    1. Davies G., and Henrissat B. (1995) Structures and mechanisms of glycosyl hydrolases. Structure 3, 853–859 - PubMed
    1. Henrissat B., and Davies G. (1997) Structural and sequence-based classification of glycoside hydrolases. Curr. Opin. Struct. Biol. 7, 637–644 - PubMed

Publication types

MeSH terms