iBet uBet web content aggregator. Adding the entire web to your favor.


Link to original content: http://www.ncbi.nlm.nih.gov/pubmed/23976882
Effects of diet on resource utilization by a model human gut microbiota containing Bacteroides cellulosilyticus WH2, a symbiont with an extensive glycobiome - PubMed Skip to main page content
U.S. flag

An official website of the United States government

Dot gov

The .gov means it’s official.
Federal government websites often end in .gov or .mil. Before sharing sensitive information, make sure you’re on a federal government site.

Https

The site is secure.
The https:// ensures that you are connecting to the official website and that any information you provide is encrypted and transmitted securely.

Access keys NCBI Homepage MyNCBI Homepage Main Content Main Navigation
. 2013;11(8):e1001637.
doi: 10.1371/journal.pbio.1001637. Epub 2013 Aug 20.

Effects of diet on resource utilization by a model human gut microbiota containing Bacteroides cellulosilyticus WH2, a symbiont with an extensive glycobiome

Affiliations

Effects of diet on resource utilization by a model human gut microbiota containing Bacteroides cellulosilyticus WH2, a symbiont with an extensive glycobiome

Nathan P McNulty et al. PLoS Biol. 2013.

Abstract

The human gut microbiota is an important metabolic organ, yet little is known about how its individual species interact, establish dominant positions, and respond to changes in environmental factors such as diet. In this study, gnotobiotic mice were colonized with an artificial microbiota comprising 12 sequenced human gut bacterial species and fed oscillating diets of disparate composition. Rapid, reproducible, and reversible changes in the structure of this assemblage were observed. Time-series microbial RNA-Seq analyses revealed staggered functional responses to diet shifts throughout the assemblage that were heavily focused on carbohydrate and amino acid metabolism. High-resolution shotgun metaproteomics confirmed many of these responses at a protein level. One member, Bacteroides cellulosilyticus WH2, proved exceptionally fit regardless of diet. Its genome encoded more carbohydrate active enzymes than any previously sequenced member of the Bacteroidetes. Transcriptional profiling indicated that B. cellulosilyticus WH2 is an adaptive forager that tailors its versatile carbohydrate utilization strategy to available dietary polysaccharides, with a strong emphasis on plant-derived xylans abundant in dietary staples like cereal grains. Two highly expressed, diet-specific polysaccharide utilization loci (PULs) in B. cellulosilyticus WH2 were identified, one with characteristics of xylan utilization systems. Introduction of a B. cellulosilyticus WH2 library comprising >90,000 isogenic transposon mutants into gnotobiotic mice, along with the other artificial community members, confirmed that these loci represent critical diet-specific fitness determinants. Carbohydrates that trigger dramatic increases in expression of these two loci and many of the organism's 111 other predicted PULs were identified by RNA-Seq during in vitro growth on 31 distinct carbohydrate substrates, allowing us to better interpret in vivo RNA-Seq and proteomics data. These results offer insight into how gut microbes adapt to dietary perturbations at both a community level and from the perspective of a well-adapted symbiont with exceptional saccharolytic capabilities, and illustrate the value of artificial communities.


Conflict of interest statement

The authors have declared that no competing interests exist.

Figures

Figure 1
Figure 1. COPRO-Seq analysis of the structure of a 12-member artificial human gut microbial community as a function of diet and time.
(A) The 12 bacterial species comprising the artificial community. (B) Principal coordinates analysis (PCoA) was applied to relative abundance data generated by COPRO-Seq from two experiments (E1, E2), each spanning 6 wk. Following colonization (day 0), mice were switched between two different diets at 2-wk intervals as described in Figure S3. COPRO-Seq data from E1 and E2 were ordinated in the same multidimensional space. For clarity, only data from E2 are shown here (for the E1 PCoA plot, see Figure S5A). Red/blue, feces; pink/cyan, cecal contents. (C) Proportional abundance data from E1 illustrating the impact of diet on fecal levels of a diet-sensitive strain with higher representation on HF/HS chow (B. caccae), a diet-sensitive strain with higher representation on LF/HPP chow (B. ovatus), a diet-insensitive strain with no obvious diet preference (B. thetaiotaomicron), and a diet-sensitive strain with a preference for the LF/HPP diet that also achieves a high level of representation on the HF/HS diet (B. cellulosilyticus WH2). Mean values ± SEM are shown. Plots illustrating changes in abundance over time for all species in both experiments are provided in Figure S4C.
Figure 2
Figure 2. B. cellulosilyticus WH2 CAZyme expression in mice fed different diets.
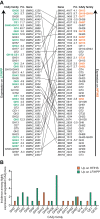
(A) Overview of the 50 most highly expressed B. cellulosilyticus WH2 CAZymes (GHs, GTs, PLs, and CEs) for samples from each diet treatment group. List position denotes the rank order of gene expression for each treatment group, with higher expression levels situated at the top of each list. Genes common to both lists are identified by a connecting line, with the slope of the line indicating the degree to which a CAZyme's prioritized expression is increased/decreased from one diet to the other. CAZy families in bold, colored letters highlight those list entries found to be significantly up-regulated relative to the alternative diet (i.e., a CAZyme with a bold green family designation was up-regulated on the LF/HPP diet; a bold orange family name implies a gene was up-regulated significantly on the HF/HS diet). Statistically significant fold-changes between diets are denoted in the “F.C.” column (nonsignificant fold-changes are omitted for clarity). (B) Breakdown by CAZy family of the top 10% most expressed CAZymes on each diet whose expression was also found to be significantly higher on one diet than the other. Note that for each diet, the family with the greatest number of up-regulated genes was also exclusively up-regulated on that diet (LF/HPP, GH43; HF/HS, GH13). In total, 25 genes representative of 27 families and 12 genes representative of 13 families are shown for the LF/HPP and HF/HS diets, respectively.
Figure 3
Figure 3. Top-down analysis of fecal microbiome RNA expression in mice receiving oscillating diets.
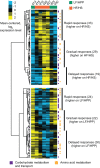
The fecal metatranscriptomes of four animals in the LF/HPP→HF/HS→LF/HPP treatment group of E2 were analyzed using microbial RNA-Seq at seven time-points to evaluate the temporal progression of changes in expressed microbial community functions triggered by a change in diet. After aligning reads to genes in the defined artificial human gut microbiome, raw counts were collapsed by the functional annotation (EC number) of the gene from which the corresponding reads originated. Total counts for each EC number in each sample were normalized, and any EC numbers demonstrating a statistically significant difference in their representation in the metatranscriptome between the final days of the first two diet phases were identified using a model based on the negative binomial distribution . Normalized expression values for 157 significant EC numbers (out of 1,021 total tested) were log-transformed, mean-centered, and subjected to hierarchical clustering, followed by heatmap visualization. “Rapid” responses are those where expression increased/decreased dramatically within 1–2 d of a diet switch. “Gradual” responses are those where expression changed notably, but slowly, between the two diet transition points. “Delayed” responses are those where significant expression changes did not occur until the end of a diet phase. EC numbers specifying enzymatic reactions relevant to carbohydrate metabolism and/or transport are denoted by purple markers, while those with relevance to amino acid metabolism are indicated using orange markers. A full breakdown of all significant responses over time and the outputs of the statistical tests performed are provided in Table S7.
Figure 4
Figure 4. Two xylanase-containing B. cellulosilyticus WH2 PULs demonstrating strong diet-specific expression patterns in vivo.
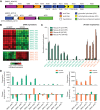
(A) The PUL spanning BWH2_404455 includes a four-gene cassette comprising two consecutive susC/D pairs, multiple genes encoding GHs and CEs, and a gene encoding a putative hybrid two-component system (HTCS) presumed to play a role in the regulation of this locus. GH10 enzymes are endo-xylanases (most often endo-β-1,4-xylanases), while some GH5 and GH8 enzymes are also known to have endo- or exo-xylanase activity. CE6 enzymes are acetyl xylan esterases, as are some members of the CE1 family. A second PUL spanning BWH2_40726 contains a susC/D cassette, an endo-xylanase with dual GH10 modules as well as dual carbohydrate (xylan) binding modules (CBM22), a hypothetical protein of unknown function, and a putative HTCS. (B) Heatmap visualization of GeneChip expression data for BWH2_404455 and BWH2_40726 showing marked up-regulation of these putative PULs when mice are fed either a plant polysaccharide-rich LF/HPP diet or a diet high in fat and simple sugar (HF/HS), respectively. Data are from cecal contents harvested from mice at the endpoint of experiment E1. (C) Mass spectrometry-based quantitation of the abundance of all cecal proteins from the BWH2_404455 and BWH2_40726 PULs that were detectable in the same material used for GeneChip quantitation in panel (B). Bars represent results (mean ± SEM) from two technical runs per sample. For each MS run, the spectral counts for each protein were normalized against the total number of B. cellulosilyticus WH2 spectra acquired. (D) Comparison of in vivo PUL gene expression as measured by RNA-Seq (top) and the degree to which disruption of each gene within each PUL by a transposon impacts the fitness of B. cellulosilyticus WH2 on each diet, as measured by insertion sequencing (INSeq, bottom). For the lower plots, fitness measurements were calculated by dividing a mutant's representation (normalized sequencing counts) within the fecal output population by its representation within an input population that was introduced into germ-free animals via a single oral gavage along with other members of the artificial community. For cases in which no instances of a particular mutant could be measured in the fecal output (resulting in a fitness calculation denominator of zero), data are plotted as “<0.01” and are drawn without error bars.
Figure 5
Figure 5. In vitro microbial RNA-Seq profiling of B. cellulosilyticus WH2 during growth on different carbohydrates.
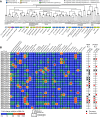
(A) Hierarchical clustering of the gene expression profiles of 90 cultures grown in minimal medium supplemented with one of 31 simple or complex sugars (n = 2–3 replicates per condition). Circles at dendrogram branch points identify clusters with strong bootstrapping support (>95%; 10,000 repetitions). Solid circles denote clusters comprising only replicates from a single treatment group/carbohydrate, while open circles denote higher level clusters comprising samples from multiple treatment groups. Colored rectangles indicate the type of carbohydrate on which the samples within each cluster were grown. (B) Unclustered heatmap representation of fold-changes in gene expression relative to growth on minimal medium plus glucose (MM-Glc) for 60 of the 236 paired susC- and susD-like genes identified within the B. cellulosilyticus WH2 genome (for a full list of all paired and unpaired susC and susD homologs, see Table S2). Data shown are limited to those genes whose expression on at least one of the 31 carbohydrates tested demonstrated a >100-fold increase relative to growth on MM-Glc for at least one of the replicates within the treatment group. Yellow boxes denote areas of the map where both genes in a susC/D pair were up-regulated >100-fold for at least two of the replicates in a treatment group and where the average up-regulation for each gene in the pair was >100-fold across all replicates of the treatment group. Two sets of columns to the right of the heatmap indicate PULs that were detectably expressed at the mRNA level (left set of columns) and/or protein level (right set of columns) in experiment 1 (E1). Red and black circles indicate that both genes in a susC/D pair were consistently expressed on a particular diet, as determined by GeneChip analysis of cecal RNA (≥5 of 7 animals assayed) or LC-MS/MS analysis of cecal protein (2 of 2 animals assayed). In both cases, a red circle denotes significantly higher expression on one diet compared to the other.

Similar articles

Cited by

References

    1. Flint HJ, Bayer EA, Rincon MT, Lamed R, White BA (2008) Polysaccharide utilization by gut bacteria: potential for new insights from genomic analysis. Nat Rev Microbiol 6: 121–131. - PubMed
    1. Gibson GR, Macfarlane GT, Cummings JH (1993) Sulphate reducing bacteria and hydrogen metabolism in the human large intestine. Gut 34: 437–439. - PMC - PubMed
    1. Roberfroid MB, Van Loo JA, Gibson GR (1998) The bifidogenic nature of chicory inulin and its hydrolysis products. J Nutr 128: 11–19. - PubMed
    1. Sela DA, Li Y, Lerno L, Wu S, Marcobal AM, et al. (2011) An infant-associated bacterial commensal utilizes breast milk sialyloligosaccharides. J Biol Chem 286: 11909–11918. - PMC - PubMed
    1. Garrido D, Barile D, Mills DA (2012) A molecular basis for bifidobacterial enrichment in the infant gastrointestinal tract. Adv Nutr 3: 415S–421S. - PMC - PubMed

Publication types