Heterogeneous models place the root of the placental mammal phylogeny
- PMID: 23813979
- PMCID: PMC3748356
- DOI: 10.1093/molbev/mst117
Heterogeneous models place the root of the placental mammal phylogeny
Abstract
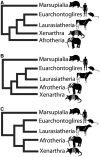
Heterogeneity among life traits in mammals has resulted in considerable phylogenetic conflict, particularly concerning the position of the placental root. Layered upon this are gene- and lineage-specific variation in amino acid substitution rates and compositional biases. Life trait variations that may impact upon mutational rates are longevity, metabolic rate, body size, and germ line generation time. Over the past 12 years, three main conflicting hypotheses have emerged for the placement of the placental root. These hypotheses place the Atlantogenata (common ancestor of Xenarthra plus Afrotheria), the Afrotheria, or the Xenarthra as the sister group to all other placental mammals. Model adequacy is critical for accurate tree reconstruction and by failing to account for these compositional and character exchange heterogeneities across the tree and data set, previous studies have not provided a strongly supported hypothesis for the placental root. For the first time, models that accommodate both tree and data set heterogeneity have been applied to mammal data. Here, we show the impact of accurate model assignment and the importance of data sets in accommodating model parameters while maintaining the power to reject competing hypotheses. Through these sophisticated methods, we demonstrate the importance of model adequacy, data set power and provide strong support for the Atlantogenata over other competing hypotheses for the position of the placental root.
Keywords: evolutionary models; heterogeneous modeling; mammal phylogeny; phylogenetic reconstruction; placental root.
Figures


Similar articles
-
Using genomic data to unravel the root of the placental mammal phylogeny.Genome Res. 2007 Apr;17(4):413-21. doi: 10.1101/gr.5918807. Epub 2007 Feb 23. Genome Res. 2007. PMID: 17322288 Free PMC article.
-
Less is more in mammalian phylogenomics: AT-rich genes minimize tree conflicts and unravel the root of placental mammals.Mol Biol Evol. 2013 Sep;30(9):2134-44. doi: 10.1093/molbev/mst116. Epub 2013 Jun 29. Mol Biol Evol. 2013. PMID: 23813978
-
The Interrelationships of Placental Mammals and the Limits of Phylogenetic Inference.Genome Biol Evol. 2016 Jan 5;8(2):330-44. doi: 10.1093/gbe/evv261. Genome Biol Evol. 2016. PMID: 26733575 Free PMC article.
-
Mammal madness: is the mammal tree of life not yet resolved?Philos Trans R Soc Lond B Biol Sci. 2016 Jul 19;371(1699):20150140. doi: 10.1098/rstb.2015.0140. Philos Trans R Soc Lond B Biol Sci. 2016. PMID: 27325836 Free PMC article. Review.
-
The new framework for understanding placental mammal evolution.Bioessays. 2009 Aug;31(8):853-64. doi: 10.1002/bies.200900053. Bioessays. 2009. PMID: 19582725 Review.
Cited by
-
Femora nutrient foramina and aerobic capacity in giant extinct xenarthrans.PeerJ. 2024 Aug 7;12:e17815. doi: 10.7717/peerj.17815. eCollection 2024. PeerJ. 2024. PMID: 39131616 Free PMC article.
-
Genome and life-history evolution link bird diversification to the end-Cretaceous mass extinction.Sci Adv. 2024 Aug 2;10(31):eadp0114. doi: 10.1126/sciadv.adp0114. Epub 2024 Jul 31. Sci Adv. 2024. PMID: 39083615 Free PMC article.
-
Accurate, scalable, and fully automated inference of species trees from raw genome assemblies using ROADIES.bioRxiv [Preprint]. 2024 Jun 1:2024.05.27.596098. doi: 10.1101/2024.05.27.596098. bioRxiv. 2024. PMID: 38854139 Free PMC article. Preprint.
-
Auditory brainstem responses in the nine-banded armadillo (Dasypus novemcinctus).PeerJ. 2023 Dec 13;11:e16602. doi: 10.7717/peerj.16602. eCollection 2023. PeerJ. 2023. PMID: 38107579 Free PMC article.
-
Identifying and addressing methodological incongruence in phylogenomics: A review.Evol Appl. 2023 Jun 6;16(6):1087-1104. doi: 10.1111/eva.13565. eCollection 2023 Jun. Evol Appl. 2023. PMID: 37360032 Free PMC article. Review.
References
-
- Altschul SF, Gish W, Miller W, Myers EW, Lipman DJ. Basic local alignment search tool. J Mol Biol. 1990;215:403–410. - PubMed
-
- Bininda-Emonds OR, Cardillo M, Jones KE, et al. (10 co-authors) The delayed rise of present-day mammals. Nature. 2007;446:507–512. - PubMed
-
- Brown WM, Prager EM, Wang A, Wilson AC. Mitochondrial DNA sequences of primates: tempo and mode of evolution. J Mol Evol. 1982;18:225–239. - PubMed
Publication types
MeSH terms
LinkOut - more resources
Full Text Sources
Other Literature Sources
Miscellaneous


