iBet uBet web content aggregator. Adding the entire web to your favor.


Link to original content: http://www.ncbi.nlm.nih.gov/pubmed/23796952
CCAT2, a novel noncoding RNA mapping to 8q24, underlies metastatic progression and chromosomal instability in colon cancer - PubMed Skip to main page content
U.S. flag

An official website of the United States government

Dot gov

The .gov means it’s official.
Federal government websites often end in .gov or .mil. Before sharing sensitive information, make sure you’re on a federal government site.

Https

The site is secure.
The https:// ensures that you are connecting to the official website and that any information you provide is encrypted and transmitted securely.

Access keys NCBI Homepage MyNCBI Homepage Main Content Main Navigation

CCAT2, a novel noncoding RNA mapping to 8q24, underlies metastatic progression and chromosomal instability in colon cancer

Hui Ling et al. Genome Res. 2013 Sep.

Abstract

The functional roles of SNPs within the 8q24 gene desert in the cancer phenotype are not yet well understood. Here, we report that CCAT2, a novel long noncoding RNA transcript (lncRNA) encompassing the rs6983267 SNP, is highly overexpressed in microsatellite-stable colorectal cancer and promotes tumor growth, metastasis, and chromosomal instability. We demonstrate that MYC, miR-17-5p, and miR-20a are up-regulated by CCAT2 through TCF7L2-mediated transcriptional regulation. We further identify the physical interaction between CCAT2 and TCF7L2 resulting in an enhancement of WNT signaling activity. We show that CCAT2 is itself a WNT downstream target, which suggests the existence of a feedback loop. Finally, we demonstrate that the SNP status affects CCAT2 expression and the risk allele G produces more CCAT2 transcript. Our results support a new mechanism of MYC and WNT regulation by the novel lncRNA CCAT2 in colorectal cancer pathogenesis, and provide an alternative explanation of the SNP-conferred cancer risk.


Figures
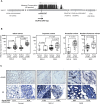
Figure 1.
Figure 1.
CCAT2, a novel lncRNA spanning rs6983267, is overexpressed in colorectal cancer samples. (A) Genomic features of the 8q24.21 region spanning SNP rs6983267 and the genomic location of CCAT2. Numbers in parentheses show the genomic distance relative to rs6983267 (image not to scale). (B) CCAT2 expression in CRC patient samples. CCAT2 expression was quantified using qRT-PCR, and data are presented as box-whisker plots showing the five statistics (lower whisker is 5% minimum, lower box part is the 25th percentile, solid line in box represents the median, upper box part is 75th percentile, and upper whisker is 95% maximum). (C) In situ hybridization of CCAT2 and RNU6-6P (U6) (as normalizer) in CRC patient samples.
Figure 2.
Figure 2.
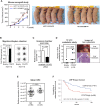
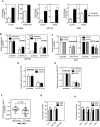
CCAT2 promotes tumor growth and metastasis. (A) CCAT2 increased subcutaneous tumor formation in a mouse xenograft model. Comparison was made between the empty vector and CCAT2 groups at the indicated weekly time points using the t-test. (B) HCT116 cells transduced with CCAT2 showed significantly higher migration ability, as measured by using a migration chamber. Data are presented as mean ± SEM from three independent experiments. (C) Knockdown of CCAT2 reduces invasion ability of KM12SM colon cancer cells. After treatment with CCAT2 siRNA (50 nM) for 24 h, cells were seeded onto an invasion assay chamber for 48 h, and invaded cells were stained and counted. (D) CCAT2 enhances liver metastasis in mice that were incubated by intrasplenic injection with HCT116 cells. A representative image of liver metastasis from the CCAT2 group is shown. (E) CCAT2 expression levels in Italian primary CRC samples from patients with metastasis (M1) were higher than those from without metastasis (M0). Comparison was made using the Mann-Whitney test. Data are presented as box-whisker plots. (F) Breast cancer patients with high CCAT2 had shorter metastasis-free survival. Kaplan-Meier analysis as a function of CCAT2 levels in 129 lymph node–positive breast cancer patients who received adjuvant combination chemotherapy with cyclophosphamide, methotrexate, and 5-fluorouracil. CCAT2 high level to normalizer, >0.0045; CCAT2 low level, ≤0.0045.
Figure 3.
Figure 3.
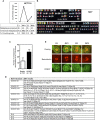
CCAT2 induces chromosomal instability in HCT116 cells. (A) Increased chromosomal abnormalities in CCAT2-overexpressing clones, as identified by genomic instability analysis. (B) Example of spectral karyotypes of HCT116 clones revealed a change from the original diploid (E1) to the tetraploid karyotype in the OC2 clone. (C,D) CCAT2 induces chromosomal instability in an independent set of CCAT2-overexpressing clones. The number of chromosomal abnormalities in each clone was counted; data are expressed as mean ± SD. (E) Abnormal centrosomes in CCAT2-overexpressing clones OC1 and OC2 by immunostaining. Beta-tubulin (red); CREST/kinetochore (green).
Figure 4.
Figure 4.
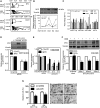
Regulation of MYC expression by CCAT2. (A) Increased CCAT2 and MYC expression in MSS CRC samples. Expression profile of MYC and CCAT2 in paired CRC/control mucosa samples from Italy using qRT-PCR. (B) Correlation of MYC protein and CCAT2 RNA levels in HCT116 clones with high and basal CCAT2 levels. (C) CCAT2 increased miRNA expression of the MIR17HG, decreased miR-146a expression, and exerted no consistent effect on let-7a (used as negative control). (D) Down-regulation of MYC (upper panel: protein; lower panel: RNA) by CCAT2 siRNA in HCT116 OC2 clone. (E) Reduced MYC expression in COLO320 shCCAT2 stable clones. (F) Reduction of MYC in doxycycline-inducible shCCAT2 clones of COLO320. (G) Reduction of migration in CCAT2-transduced HCT116 cells by anti-miR-17-5p and anti-miR-20a. Twenty-four hours after anti-miR treatment, cells were seeded onto a migration assay chamber for another 24 h, and migrated cells were stained and counted. (*) P < 0.05.
Figure 5.
Figure 5.
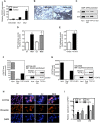
Regulation of TCF7L2 activity by CCAT2. (A) CCAT2 nuclear localization, as identified using qRT-PCR in fractionated COLO320 cells and HCT116 CCAT2 clones. (B) CCAT2 nuclear localization, as identified in CRC samples using in situ hybridization. (C) CCAT2 increased TCF7L2 binding to the MYC promoter. ChIP analysis showed higher binding in CCAT2-overexpressing clone (OC1) than cells with basal CCAT2 expression (E1). Goat IgG was used as a control antibody. (D) Higher WNT activity in CCAT2 stable clones, as identified by TOP-Flash reporter assay. (E) Transient expression of CCAT2 induced a more than twofold increase of TOP-Flash luciferase activity in HEK293 cells. The data in C and D are presented as mean ± SEM (n = 3). (*) P < 0.05. (F) Colocalization of CCAT2 RNA with TCF7L2 protein by RNA immunoprecipitation using anti-TCF7L2 antibodies in OC1 with ectopic CCAT2 overexpression. (G) Colocalization of CCAT2 RNA with TCF7L2 protein by RNA immunoprecipitation using anti-TCF7L2 in COLO320 cells, which have endogenous high CCAT2 expression. A quantitative analysis using qRT-PCR is shown along with the PCR gel images. (H) Immunostaining of HCT116 clones with vimentin antibody or DAPI. Stronger vimentin signal as seen in epithelial–mesenchymal transition was observed in CCAT2-overexpressing clones than in cells with basal CCAT2 expression. (I) CCAT2 increases the mRNA expression levels of CD44 and VIM in HCT116 clones. The data are presented as mean ± SEM from at least three independent experiments. (*) P < 0.05.
Figure 6.
Figure 6.
Regulation of CCAT2 expression by WNT signaling and SNP variance on CCAT2 expression. (A) CCAT2 expression is induced by lithium chloride (LiCl) in three colon cancer cell lines. AXIN2 or TOP-Flash luciferase activity served as a positive control for the activation of WNT signaling. The data are presented as mean ± SD (n = 3). (B) TCF7L2 is indispensable for LiCl-induced CCAT2 expression. HCT116 cells were treated with TCF7L2 siRNA (siGENOME SMARTpool TCF7L2; Dharmacon) for 24 h and then stimulated with LiCl for another 24 h. CCAT2 expression levels were measured by qRT-PCR. (C) TCF7L2 siRNA down-regulates CCAT2 expression in overexpressing OC2 clone, either with or without LiCl stimulation. (D,E) TCF7L2 siRNA (sc43525, Santa Cruz) down-regulates CCAT2 expression in KM12SM cells and COLO320 cells. The data are presented as mean ± SEM (n = 3); (*) P < 0.05 when compared with the respective control. (F) Comparison of CCAT2 expression in cohort of CRC samples from Italy with GG and TT genotype showed higher CCAT2 expression associated with the G allele. The P-value was calculated using the Mann-Whitney test. The data are presented as box-whisker plots. (G,H) The Pyrosequencing data showed a higher percentage of the G allele in the CCAT2 transcripts than its genomic DNA counterpart in heterogeneous rs6983267 cell lines (DLD1 and KM12SM) and CRC patient samples with GT genotype. COLO320, which is TT genotype, served here as a negative control.
Figure 7.
Figure 7.
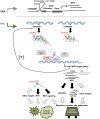
A model of CCAT2 locus involvement in CRC. (Upper panel) An ∼335-kb DNA loop brings the rs6983267 genomic region close to the MYC locus, and this physical association may contribute to the enhancer function of the SNP-containing region on MYC transcription (Pomerantz et al. 2009). (Lower panel) The enhancer region is transcribed into a long noncoding RNA (CCAT2), and the SNP status affects CCAT2 expression by an as-yet-unknown mechanism. The CCAT2 transcript up-regulates WNT activity and increases expression levels of WNT target genes (including MYC). This regulation by CCAT2, possibly through its physical interaction with TCF7L2, may lead to genomic instability and promote cell growth. We demonstrated that MYC-regulated miR-17-5p and miR-20a participate in the CCAT2-enhanced cell invasion and speculate that other mechanisms, such as MYC-related mechanisms (CDC25A) or enhanced WNT signaling (VIM and CD44), may exist to coordinate the metastatic phenotype elicited by CCAT2. Finally, we demonstrated that CCAT2 expression is regulated by transcriptional factors TCF7L2, indicating a positive feedback loop between CCAT2 and WNT signaling. Our findings provide an additional explanation on the SNP-conferred CRC risk. (Black) Demonstrated; (gray) hypothesized interactions.

Similar articles

Cited by

References

    1. Ambros V 2001. microRNAs: Tiny regulators with great potential. Cell 107: 823–826 - PubMed
    1. Aoki K, Aoki M, Sugai M, Harada N, Miyoshi H, Tsukamoto T, Mizoshita T, Tatematsu M, Seno H, Chiba T, et al. 2007. Chromosomal instability by β-catenin/TCF transcription in APC or β-catenin mutant cells. Oncogene 26: 3511–3520 - PubMed
    1. Bartley AN, Yao H, Barkoh BA, Ivan C, Mishra BM, Rashid A, Calin GA, Luthra R, Hamilton SR 2011. Complex patterns of altered microRNA expression during the adenoma-adenocarcinoma sequence for microsatellite-stable colorectal cancer. Clin Cancer Res 17: 7283–7293 - PMC - PubMed
    1. Bejerano G, Pheasant M, Makunin I, Stephen S, Kent WJ, Mattick JS, Haussler D 2004. Ultraconserved elements in the human genome. Science 304: 1321–1325 - PubMed
    1. Bertucci F, Lagarde A, Ferrari A, Finetti P, Charafe-Jauffret E, Van Laere S, Adelaide J, Viens P, Thomas G, Birnbaum D, et al. 2012. 8q24 cancer risk allele associated with major metastatic risk in inflammatory breast cancer. PLoS ONE 7: e37943. - PMC - PubMed

Publication types

MeSH terms