iBet uBet web content aggregator. Adding the entire web to your favor.


Link to original content: http://www.ncbi.nlm.nih.gov/pubmed/23239622
Variable clonal repopulation dynamics influence chemotherapy response in colorectal cancer - PubMed Skip to main page content
U.S. flag

An official website of the United States government

Dot gov

The .gov means it’s official.
Federal government websites often end in .gov or .mil. Before sharing sensitive information, make sure you’re on a federal government site.

Https

The site is secure.
The https:// ensures that you are connecting to the official website and that any information you provide is encrypted and transmitted securely.

Access keys NCBI Homepage MyNCBI Homepage Main Content Main Navigation
. 2013 Feb 1;339(6119):543-8.
doi: 10.1126/science.1227670. Epub 2012 Dec 13.

Variable clonal repopulation dynamics influence chemotherapy response in colorectal cancer

Affiliations

Variable clonal repopulation dynamics influence chemotherapy response in colorectal cancer

Antonija Kreso et al. Science. .

Abstract

Intratumoral heterogeneity arises through the evolution of genetically diverse subclones during tumor progression. However, it remains unknown whether cells within single genetic clones are functionally equivalent. By combining DNA copy number alteration (CNA) profiling, sequencing, and lentiviral lineage tracking, we followed the repopulation dynamics of 150 single lentivirus-marked lineages from 10 human colorectal cancers through serial xenograft passages in mice. CNA and mutational analysis distinguished individual clones and showed that clones remained stable upon serial transplantation. Despite this stability, the proliferation, persistence, and chemotherapy tolerance of lentivirally marked lineages were variable within each clone. Chemotherapy promoted the dominance of previously minor or dormant lineages. Thus, apart from genetic diversity, tumor cells display inherent functional variability in tumor propagation potential, which contributes to both cancer growth and therapy tolerance.


Figures

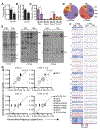
Fig. 1.
Fig. 1.
Xenograft characterization. (A) Diagnostic tumor samples were transduced with a Lentiviral vector encoding GFP, and 5 × 10⁴ to 2 × 10⁵ viable cells were transplanted into immunodeficient mice. Once tumors formed (1°), an equal number of cells was transplanted into the next passage. Time to tumor formation from previous injection for each transplant is shown. Each point is the mean of all recipients at the indicated passage. (B) DNA from diagnostic and matching 1°, 2°, 4°, and 5° tumor transplants was profiled using Affymetrix SNP 6.0 arrays. Raw log2 ratios are shown (median smoothing format; blue, deletion; white, normal; red, gain). (C) DNA from diagnostic and xenograft derived tumors was sequenced using the RainDance platform. Frequency of both germline (gray circles) and somatic variants (colored circles) is shown. Each circle represents data of one xenograft-derived tumor as compared to the patient tumor sample; there are three or four xenografts per passage. Data are not normalized for copy number changes and tumor cellularity, although generally >80% of cells are estimated to be tumor cells.
Fig. 2.
Fig. 2.
Variation in repopulation potential of individual lentivirally-marked CRC cells. (A) DNA from xenografts (one tumor per lane) of various transplants (denoted by 1°, 2°, …, 5°) was analyzed using Southern blotting with a GFP probe. Arrows above certain lanes indicate the tumor that was retransplanted into the next set of mice. Colored arrowheads indicate representative examples of different lentivirally marked (LV) clone types. (B) Pie chart showing the sum of each of the five LV clone types observed over all experiments. (C) Schematic illustrating the different types of LV clonal behaviors. LV clones were classified on the basis of detection in serial transplants; for example, a type IV clone would be below the detection limit initially and come up in later transplants. (D) Charts showing the proportion of LV clone types for each patient sample, displayed as the averages of all mice per transplant. The proportion of each LV clone type was determined in every recipient mouse by dividing the number of times a particular LV clone type was observed by the total number of LV clones detected in that mouse, thereby normalizing for differential marking of samples. Next, the proportion of each LV clone type for all recipients per transplant was averaged, including recipients for which LV clones were not detected. Each bar is representative of the averaged data at a transplant, and error bars indicate SEM between the tumors; n denotes the number of tumors or recipients analyzed.
Fig. 3.
Fig. 3.
Variable response of marked clones to oxaliplatin. Mice were either treated with phosphatebuffered saline (Ctrl) or oxaliplatin (OX) for 2 to 4 weeks and cells from these tumors were reinjected into mice, which did not receive further treatment. Once new tumors formed (about 100 days after reinjection), mice from both groups were killed and tumor weight was measured. (A) Previously OX-treated tumor weights were normalized to Ctrl tumor weights;data were pooled from five patient samples representing 31 Ctrl and 29 previously OX-treated samples. (B) Cumulative number of LV clones per mouse after transplantation of OX-treated tumors. (C) The proportion of LV clone types in tumors that were generated by reinjecting Ctrl and OX-treated tumors. LV clone types were assigned according to the behavior of individual clones across all transplants over the entire experiment. Data are means ± SEM of pooled data from independent OX treatments using different patient samples; P values were calculated using two-tailed t test. (D) Pie chart showing the number of times the LV clone types were observed, represented as the sum of all experiments. (E) Southern blot showing the LV clonal makeup of tumors generated by reinjecting tumor cells from OX-treated recipients. Representative data from three patient samples are shown; solid arrowheads to the right of each experiment identify newly appearing LV clones in the previously OX-treated tumors. Each lane represents the DNA of one mouse. For comparative purposes, the Southern blot for CT38 Ctrl is the same as in Fig. 2A. (F and G) DNA from tumors that were generated by reinjecting Ctrl or OX-treated samples was analyzed using CNA arrays (F) or targeted deep sequencing (G). In (F), raw log2 ratio copy number data are shown in median-smoothing format (blue, deletion; white, normal; red, gain). For comparative purposes, data for Ctrl in (F) and (G) are reproductions of 4° (CT38) and 5° (CT54) transplants from Fig. 1, B and C.

Comment in

Similar articles

  • Tumor heterogeneity and response to chemotherapy.
    Sugino S, Janicki PK. Sugino S, et al. Pharmacogenomics. 2013 Dec;14(16):1949. doi: 10.2217/pgs.13.175. Pharmacogenomics. 2013. PMID: 24279849 No abstract available.
  • Genetic subclone architecture of tumor clone-initiating cells in colorectal cancer.
    Giessler KM, Kleinheinz K, Huebschmann D, Balasubramanian GP, Dubash TD, Dieter SM, Siegl C, Herbst F, Weber S, Hoffmann CM, Fronza R, Buchhalter I, Paramasivam N, Eils R, Schmidt M, von Kalle C, Schneider M, Ulrich A, Scholl C, Fröhling S, Weichert W, Brors B, Schlesner M, Ball CR, Glimm H. Giessler KM, et al. J Exp Med. 2017 Jul 3;214(7):2073-2088. doi: 10.1084/jem.20162017. Epub 2017 Jun 1. J Exp Med. 2017. PMID: 28572216 Free PMC article.
  • Spatiotemporal regulation of clonogenicity in colorectal cancer xenografts.
    van der Heijden M, Miedema DM, Waclaw B, Veenstra VL, Lecca MC, Nijman LE, van Dijk E, van Neerven SM, Lodestijn SC, Lenos KJ, de Groot NE, Prasetyanti PR, Arricibita Varea A, Winton DJ, Medema JP, Morrissey E, Ylstra B, Nowak MA, Bijlsma MF, Vermeulen L. van der Heijden M, et al. Proc Natl Acad Sci U S A. 2019 Mar 26;116(13):6140-6145. doi: 10.1073/pnas.1813417116. Epub 2019 Mar 8. Proc Natl Acad Sci U S A. 2019. PMID: 30850544 Free PMC article.
  • Intratumoral functional heterogeneity and chemotherapy.
    Sipos F, Constantinovits M, Műzes G. Sipos F, et al. World J Gastroenterol. 2014 Mar 14;20(10):2429-32. doi: 10.3748/wjg.v20.i10.2429. World J Gastroenterol. 2014. PMID: 24627580 Free PMC article. Review.
  • Intratumor heterogeneity: A new perspective on colorectal cancer research.
    Zheng Z, Yu T, Zhao X, Gao X, Zhao Y, Liu G. Zheng Z, et al. Cancer Med. 2020 Oct;9(20):7637-7645. doi: 10.1002/cam4.3323. Epub 2020 Aug 27. Cancer Med. 2020. PMID: 32853464 Free PMC article. Review.

Cited by

References

    1. Greaves M, Maley CC, Nature 481, 306 (2012). - PMC - PubMed
    1. Nik-Zainal S et al. Breast Cancer Working Group of the International Cancer Genome Consortium, Cell 149, 994 (2012). - PubMed
    1. Gerlinger M et al. N. Engl. J. Med 366, 883 (2012). - PMC - PubMed
    1. Anderson K et al. Nature 469, 356 (2011). - PubMed
    1. Notta F et al. Nature 469, 362 (2011). - PubMed

Publication types