Analyzing the spatio-temporal relationship between dengue vector larval density and land-use using factor analysis and spatial ring mapping
- PMID: 23043443
- PMCID: PMC3598814
- DOI: 10.1186/1471-2458-12-853
Analyzing the spatio-temporal relationship between dengue vector larval density and land-use using factor analysis and spatial ring mapping
Abstract
Background: Dengue, a mosquito-borne febrile viral disease, is found in tropical and sub-tropical regions and is now extending its range to temperate regions. The spread of the dengue viruses mainly depends on vector population (Aedes aegypti and Aedes albopictus), which is influenced by changing climatic conditions and various land-use/land-cover types. Spatial display of the relationship between dengue vector density and land-cover types is required to describe a near-future viral outbreak scenario. This study is aimed at exploring how land-cover types are linked to the behavior of dengue-transmitting mosquitoes.
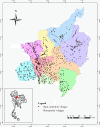
Methods: Surveys were conducted in 92 villages of Phitsanulok Province Thailand. The sampling was conducted on three separate occasions in the months of March, May and July. Dengue indices, i.e. container index (C.I.), house index (H.I.) and Breteau index (B.I.) were used to map habitats conducible to dengue vector growth. Spatial epidemiological analysis using Bivariate Pearson's correlation was conducted to evaluate the level of interdependence between larval density and land-use types. Factor analysis using principal component analysis (PCA) with varimax rotation was performed to ascertain the variance among land-use types. Furthermore, spatial ring method was used as to visualize spatially referenced, multivariate and temporal data in single information graphic.
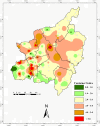
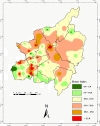
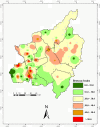
Results: Results of dengue indices showed that the settlements around gasoline stations/workshops, in the vicinity of marsh/swamp and rice paddy appeared to be favorable habitat for dengue vector propagation at highly significant and positive correlation (p = 0.001) in the month of May. Settlements around the institutional areas were highly significant and positively correlated (p = 0.01) with H.I. in the month of March. Moreover, dengue indices in the month of March showed a significant and positive correlation (p <= 0.05) with deciduous forest. The H.I. of people living around horticulture land were significantly and positively correlated (p = 0.05) during the month of May, and perennial vegetation showed a highly significant and positive correlation (p = 0.001) in the month of March with C.I. and significant and positive correlation (p <= 0.05) with B.I., respectively.
Conclusions: The study concluded that gasoline stations/workshops, rice paddy, marsh/swamp and deciduous forests played highly significant role in dengue vector growth. Thus, the spatio-temporal relationships of dengue vector larval density and land-use types may help to predict favorable dengue habitat, and thereby enables public healthcare managers to take precautionary measures to prevent impending dengue outbreak.
Figures




Similar articles
-
Larval habitats and distribution patterns of Aedes aegypti (Linnaeus) and Aedes albopictus (Skuse), in Thailand.Southeast Asian J Trop Med Public Health. 2003 Sep;34(3):529-35. Southeast Asian J Trop Med Public Health. 2003. PMID: 15115122
-
Role of Aedes aegypti (Linnaeus) and Aedes albopictus (Skuse) in local dengue epidemics in Taiwan.BMC Infect Dis. 2016 Nov 9;16(1):662. doi: 10.1186/s12879-016-2002-4. BMC Infect Dis. 2016. PMID: 27829399 Free PMC article.
-
Spatially disaggregated disease transmission risk: land cover, land use and risk of dengue transmission on the island of Oahu.Trop Med Int Health. 2011 Feb;16(2):174-85. doi: 10.1111/j.1365-3156.2010.02671.x. Epub 2010 Nov 14. Trop Med Int Health. 2011. PMID: 21073638 Free PMC article.
-
Critical review of the vector status of Aedes albopictus.Med Vet Entomol. 2004 Sep;18(3):215-27. doi: 10.1111/j.0269-283X.2004.00513.x. Med Vet Entomol. 2004. PMID: 15347388 Review.
-
[Prediction and prevention of dengue epidemics].Bull Soc Pathol Exot. 1996;89(2):123-6; discussion 127. Bull Soc Pathol Exot. 1996. PMID: 8924770 Review. French.
Cited by
-
Spatiotemporal Modeling of Aedes aegypti Risk: Enhancing Dengue Virus Control through Meteorological and Remote Sensing Data in French Guiana.Pathogens. 2024 Aug 29;13(9):738. doi: 10.3390/pathogens13090738. Pathogens. 2024. PMID: 39338929 Free PMC article.
-
Effects of climate change and human activities on vector-borne diseases.Nat Rev Microbiol. 2024 Aug;22(8):476-491. doi: 10.1038/s41579-024-01026-0. Epub 2024 Mar 14. Nat Rev Microbiol. 2024. PMID: 38486116 Review.
-
How habitat factors affect an Aedes mosquitoes driven outbreak at temperate latitudes: The case of the Chikungunya virus in Italy.PLoS Negl Trop Dis. 2023 Aug 17;17(8):e0010655. doi: 10.1371/journal.pntd.0010655. eCollection 2023 Aug. PLoS Negl Trop Dis. 2023. PMID: 37590255 Free PMC article.
-
Predictors of Dengue Preventive Practices Based on Precaution Adoption Process Model among Health Care Professionals in Northwest of Iran.J Arthropod Borne Dis. 2022 Dec 31;16(4):340-349. doi: 10.18502/jad.v16i4.12192. eCollection 2022 Dec. J Arthropod Borne Dis. 2022. PMID: 37159598 Free PMC article.
-
WebGIS-Based Real-Time Surveillance and Response System for Vector-Borne Infectious Diseases.Int J Environ Res Public Health. 2023 Feb 20;20(4):3740. doi: 10.3390/ijerph20043740. Int J Environ Res Public Health. 2023. PMID: 36834443 Free PMC article.
References
-
- World Health Organization Regional Office for South-East Asia. Comprehensive Guidelines for Prevention and Control of Dengue and Dengue Haemorrhagic Fever. New Delhi, India; 2011. http://www.searo.who.int/LinkFiles/Dengue_DHF_prevention&control_guideli....
Publication types
MeSH terms
LinkOut - more resources
Full Text Sources
Medical


