iBet uBet web content aggregator. Adding the entire web to your favor.


Link to original content: http://www.ncbi.nlm.nih.gov/pubmed/22260278
Influenza research database: an integrated bioinformatics resource for influenza research and surveillance - PubMed Skip to main page content
U.S. flag

An official website of the United States government

Dot gov

The .gov means it’s official.
Federal government websites often end in .gov or .mil. Before sharing sensitive information, make sure you’re on a federal government site.

Https

The site is secure.
The https:// ensures that you are connecting to the official website and that any information you provide is encrypted and transmitted securely.

Access keys NCBI Homepage MyNCBI Homepage Main Content Main Navigation
. 2012 Nov;6(6):404-16.
doi: 10.1111/j.1750-2659.2011.00331.x. Epub 2012 Jan 20.

Influenza research database: an integrated bioinformatics resource for influenza research and surveillance

Affiliations

Influenza research database: an integrated bioinformatics resource for influenza research and surveillance

R Burke Squires et al. Influenza Other Respir Viruses. 2012 Nov.

Abstract

Background: The recent emergence of the 2009 pandemic influenza A/H1N1 virus has highlighted the value of free and open access to influenza virus genome sequence data integrated with information about other important virus characteristics.

Design: The Influenza Research Database (IRD, http://www.fludb.org) is a free, open, publicly-accessible resource funded by the U.S. National Institute of Allergy and Infectious Diseases through the Bioinformatics Resource Centers program. IRD provides a comprehensive, integrated database and analysis resource for influenza sequence, surveillance, and research data, including user-friendly interfaces for data retrieval, visualization and comparative genomics analysis, together with personal log in-protected 'workbench' spaces for saving data sets and analysis results. IRD integrates genomic, proteomic, immune epitope, and surveillance data from a variety of sources, including public databases, computational algorithms, external research groups, and the scientific literature.

Results: To demonstrate the utility of the data and analysis tools available in IRD, two scientific use cases are presented. A comparison of hemagglutinin sequence conservation and epitope coverage information revealed highly conserved protein regions that can be recognized by the human adaptive immune system as possible targets for inducing cross-protective immunity. Phylogenetic and geospatial analysis of sequences from wild bird surveillance samples revealed a possible evolutionary connection between influenza virus from Delaware Bay shorebirds and Alberta ducks.

Conclusions: The IRD provides a wealth of integrated data and information about influenza virus to support research of the genetic determinants dictating virus pathogenicity, host range restriction and transmission, and to facilitate development of vaccines, diagnostics, and therapeutics.


Figures

Figure 1
Figure 1
Influenza Research Database (IRD) home page – The IRD home page provides easy access to search interfaces (Search), comparative genomics analysis and visualization tools (Analyze), and a user’s personal workbench (Save to Workbench) (red arrows). The Data Summary section provides a quick overview of the current IRD data content and the date of last update (green arrow). Other sections highlight some of the novel analysis and visualization tools (Highlights), recent publications from the influenza research community (Community Spotlight), and upcoming events and recent data submissions (Announcements).
Figure 2
Figure 2
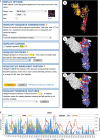
Data integration in the 3D protein viewer – In the Influenza Research Database (IRD) enhanced version of the JMol 3D protein viewer, users can visualize selected influenza protein structures and choose a variety of different customization features (A). The structure (1EO8) of an H3 hemagglutinin (HA) protein in complex with a neutralizing antibody (white residues in upper left portion of structures in C and D) is shown. Users can choose different display types including ribbon diagrams (B) and space filling models (C, D). The 3D viewer also integrates data from the IRD database, so that users can color protein structures based on pre‐computed sequence conservation score (C, D), with highly conserved residues colored in blue and highly variable residues colored in red. Users can also highlight the location of selected immune epitopes (the B‐cell epitope Immune Epitope Database [IEDB] ID:33413 is colored yellow in D) and other pre‐compiled sequence features. The HA conserved epitope region (CER)1 is shown highlighted in green (see below). (E) Influenza segment sequence variation as measured by polymorphism score (poly) plotted in comparison with epitope coverage. Sequence polymorphism scores were computed for human H1N1 subtype HA sequences using a formula adapted from Crooks et al. 47 and downloaded from the IRD, with scores for proteins ranging from 0 (fully conserved) to 432 (all amino acids equally represented at a position). In order to visualize the regions of sequence variation, an average polymorphism score was computed using a 5‐amino‐acid sliding window. An epitope coverage score was computed by counting the number of epitopes that occur at each amino acid position. T‐cell and MHC‐binding epitope data shown are from human only, while B‐cell epitope data are from all host species. Colored bars at the top of each chart show regions of high immunological activity but little sequence variation – CER. Conserved epitope regions are colored as follows: HA‐CER1 (25–50, green), HA‐CER2 (115–130, red), HA‐CER3 (340–375, black), HA‐CER4 (395–410, purple), and HA‐CER5 (435–450, orange). The location of the B‐cell epitope IEDB ID:33413 is highlighted with yellow asterisks.
Figure 3
Figure 3
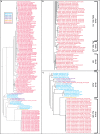
Influenza Research Database (IRD) phylogenetic trees – (A) In the IRD enhanced version of the Archaeopteryx tree visualization tool, the user can color‐code branch nodes based on a variety of different sequence annotation characteristics from the IRD database, in this case year of isolation grouped into 5‐year intervals. Phylogenetic relationships between hemagglutinin nucleotide sequences from all H4 influenza subtype viruses isolated from aquatic ducks (Anatidae family) and shorebirds (Scolopacidae family) available in IRD surveillance records as of July 2011 are shown using the IRD “Quick Tree” maximum‐likelihood estimation based on the HKY model of evolution. (B) An expanded view of the major 2005–2009 Minnesota (MN), North Dakota (ND), Texas (TX), Alaska (AK), and California (CA) duck branch. (C) An expanded view of the New Jersey (NJ) and Delaware (DE) shorebird branch with related Alberta (ALB) duck isolates from pre‐2005.
Figure 4
Figure 4
Influenza Research Database (IRD) multiple sequence alignment – H4 hemagglutinin nucleotide sequences from the aquatic duck and shorebird surveillance samples were aligned using the MUltiple Sequence Comparison by Log‐Expectation algorithm and visualized using the IRD enhanced JalView. Bar graph of sequence conservation values along with the computed consensus sequence is shown at the bottom. Nucleotide residues shared by Alberta (ALB) duck and Delaware Bay (NJ, DE) shorebird isolates but not by the Minnesota (MN), North Dakota (ND), or Texas (TX) isolates are noted with red arrows. Residues unique to Alberta ducks (blue arrow) or shorebirds (green arrows) are also highlighted.
Figure 5
Figure 5
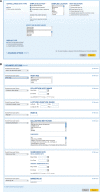
Surveillance data search interface – (A) Influenza Research Database (IRD) data are accessed through a variety of different customized search interfaces in which commonly used search criteria are initially displayed. In the case of animal surveillance data, these include sampling location, host, and whether influenza virus was detected and sequenced. Branching logic is used to add additional search criteria based on other selections; choosing the “Select family by list” radio button pops up a new box with avian family names listed. (B) In addition to the commonly used criteria, IRD also allows for searching by other characteristics (e.g., host age, collection date, latitude and longitude coordinates of collection site) as advanced options.
Figure 6
Figure 6
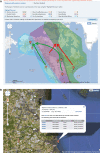
Google Map view of H4 flu‐positive avian surveillance sample isolation locations – Balloons show the geospatial location of surveillance sample isolation locations based on the latitude and longitude coordinates. Both geopolitical views (A) and satellite images (B) are available options, with custom zooming. Each balloon can be expanded to view more detailed information about the surveillance samples represented (B). Additional geospatial information (e.g., mapped avian migration flyways) can be overlaid to view the spatial relationships with surveillance sampling locations (A). Possible avian migration‐based influenza virus spreading routes suggested by the phylogenetic (Figure 3) and sequence alignment (Figure 4) analysis are indicated with red arrows for the Alberta duck/Delaware Bay shorebird clade and green arrows for the Texas, Minnesota, North Dakota, Alaska, and California duck clade (A).
Figure 7
Figure 7
Overview of the Influenza Research Database (IRD) Use Case – The IRD use case consists of four steps – sequence search, phylogenetic analysis, sequence alignment, and Google Map visualization, which save data to and retried data from the IRD Workbench. Results of selected steps are shown in 3, 4, 5, 6.

Similar articles

Cited by

References

    1. Greene JM, Collins F, Lefkowitz EJ et al. National institute of allergy and infectious diseases bioinformatics resource centers: new assets for pathogen informatics. Infect Immun 2007; 75:3212–3219. - PMC - PubMed
    1. Palese P, Shaw ML. Orthomyxoviridae: the viruses and their replication; in Fields BN, Knipe DM, Howley PM. (eds): Fields’ Virology. Philadelphia: Wolters Kluwer Health/Lippincott Williams & Wilkins, 2007; 1647–1689.
    1. Kruse H, Kirkemo AM, Handeland K. Wildlife as source of zoonotic infections. Emerg Infect Dis 2004; 10:2067–2072. - PMC - PubMed
    1. World Health Organization . Influenza web page. Available at http://www.who.int/mediacentre/factsheets/fs211/en/ (Accessed 22 July 2011).
    1. Fraser C, Donnelly CA, Cauchemez S et al. Pandemic potential of a strain of influenza A (H1N1): early findings. Science 2009; 324:1557–1561. - PMC - PubMed

Publication types

MeSH terms