Spatial evaluation and modeling of Dengue seroprevalence and vector density in Rio de Janeiro, Brazil
- PMID: 19901983
- PMCID: PMC2768822
- DOI: 10.1371/journal.pntd.0000545
Spatial evaluation and modeling of Dengue seroprevalence and vector density in Rio de Janeiro, Brazil
Abstract
Background: Rio de Janeiro, Brazil, experienced a severe dengue fever epidemic in 2008. This was the worst epidemic ever, characterized by a sharp increase in case-fatality rate, mainly among younger individuals. A combination of factors, such as climate, mosquito abundance, buildup of the susceptible population, or viral evolution, could explain the severity of this epidemic. The main objective of this study is to model the spatial patterns of dengue seroprevalence in three neighborhoods with different socioeconomic profiles in Rio de Janeiro. As blood sampling coincided with the peak of dengue transmission, we were also able to identify recent dengue infections and visually relate them to Aedes aegypti spatial distribution abundance. We analyzed individual and spatial factors associated with seroprevalence using Generalized Additive Model (GAM).
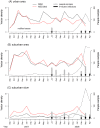
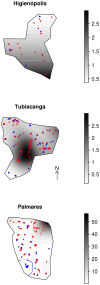
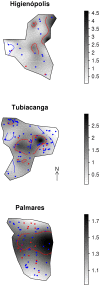
Methodology/principal findings: Three neighborhoods were investigated: a central urban neighborhood, and two isolated areas characterized as a slum and a suburban area. Weekly mosquito collections started in September 2006 and continued until March 2008. In each study area, 40 adult traps and 40 egg traps were installed in a random sample of premises, and two infestation indexes calculated: mean adult density and mean egg density. Sera from individuals living in the three neighborhoods were collected before the 2008 epidemic (July through November 2007) and during the epidemic (February through April 2008). Sera were tested for DENV-reactive IgM, IgG, Nested RT-PCR, and Real Time RT-PCR. From the before-after epidemics paired data, we described seroprevalence, recent dengue infections (asymptomatic or not), and seroconversion. Recent dengue infection varied from 1.3% to 14.1% among study areas. The highest IgM seropositivity occurred in the slum, where mosquito abundance was the lowest, but household conditions were the best for promoting contact between hosts and vectors. By fitting spatial GAM we found dengue seroprevalence hotspots located at the entrances of the two isolated communities, which are commercial activity areas with high human movement. No association between recent dengue infection and household's high mosquito abundance was observed in this sample.
Conclusions/significance: This study contributes to better understanding the dynamics of dengue in Rio de Janeiro by assessing the relationship between dengue seroprevalence, recent dengue infection, and vector density. In conclusion, the variation in spatial seroprevalence patterns inside the neighborhoods, with significantly higher risk patches close to the areas with large human movement, suggests that humans may be responsible for virus inflow to small neighborhoods in Rio de Janeiro. Surveillance guidelines should be further discussed, considering these findings, particularly the spatial patterns for both human and mosquito populations.
Conflict of interest statement
The authors have declared that no competing interests exist.
Figures


Similar articles
-
Spatial dimensions of dengue virus transmission across interepidemic and epidemic periods in Iquitos, Peru (1999-2003).PLoS Negl Trop Dis. 2012;6(2):e1472. doi: 10.1371/journal.pntd.0001472. Epub 2012 Feb 21. PLoS Negl Trop Dis. 2012. PMID: 22363822 Free PMC article.
-
Spatial Analysis of Dengue Seroprevalence and Modeling of Transmission Risk Factors in a Dengue Hyperendemic City of Venezuela.PLoS Negl Trop Dis. 2017 Jan 23;11(1):e0005317. doi: 10.1371/journal.pntd.0005317. eCollection 2017 Jan. PLoS Negl Trop Dis. 2017. PMID: 28114342 Free PMC article.
-
Dengue infection in Paracambi, State of Rio de Janeiro, 1990-1995.Rev Soc Bras Med Trop. 1997 Sep-Oct;30(5):379-83. doi: 10.1590/s0037-86821997000500005. Rev Soc Bras Med Trop. 1997. PMID: 9322424
-
[Dengue and its vectors in Brazil].Bull Soc Pathol Exot. 1996;89(2):128-35; discussion 136. Bull Soc Pathol Exot. 1996. PMID: 8924771 Review. French.
-
Dengue in the Middle East and North Africa: A Systematic Review.PLoS Negl Trop Dis. 2016 Dec 7;10(12):e0005194. doi: 10.1371/journal.pntd.0005194. eCollection 2016 Dec. PLoS Negl Trop Dis. 2016. PMID: 27926925 Free PMC article. Review.
Cited by
-
A systematic review of the data, methods and environmental covariates used to map Aedes-borne arbovirus transmission risk.BMC Infect Dis. 2023 Oct 20;23(1):708. doi: 10.1186/s12879-023-08717-8. BMC Infect Dis. 2023. PMID: 37864153 Free PMC article.
-
Asymptomatic dengue infection rate: A systematic literature review.Heliyon. 2023 Sep 16;9(9):e20069. doi: 10.1016/j.heliyon.2023.e20069. eCollection 2023 Sep. Heliyon. 2023. PMID: 37809992 Free PMC article. Review.
-
Differences in Longevity and Temperature-Driven Extrinsic Incubation Period Correlate with Varying Dengue Risk in the Arizona-Sonora Desert Region.Viruses. 2023 Mar 26;15(4):851. doi: 10.3390/v15040851. Viruses. 2023. PMID: 37112832 Free PMC article.
-
A systematic review of published literature on mosquito control action thresholds across the world.PLoS Negl Trop Dis. 2023 Mar 3;17(3):e0011173. doi: 10.1371/journal.pntd.0011173. eCollection 2023 Mar. PLoS Negl Trop Dis. 2023. PMID: 36867651 Free PMC article.
-
Knowledge, Attitudes, and Practices of the Population in Jazan Region, Saudi Arabia Regarding Dengue Fever and Its Prevention Measures: A Community-Based Cross-Sectional Study.Int J Environ Res Public Health. 2022 Dec 14;19(24):16812. doi: 10.3390/ijerph192416812. Int J Environ Res Public Health. 2022. PMID: 36554693 Free PMC article.
References
-
- Schatzmayr HG. Dengue situation in Brazil by year 2000. Mem Inst Oswaldo Cruz. 2000;95:179–181. - PubMed
-
- Gubler DJ, Kuno G. Wallingford, United Kingdom: CAB International; 1997. Dengue and Dengue Hemorrhagic Fever:
-
- Scott TW, Lorenz LH, Clark GG, Strickman D, Kittayapong P, et al. Longitudinal studies of Aedes aegypti (Diptera: Culicidae) in Thailand and Puerto Rico: blood feeding frequency. J Med Entomol. 2000;37:89–101. - PubMed
-
- Halstead SB. Dengue. Lancet. 2007;370:1644–1652. - PubMed
Publication types
MeSH terms
Substances
LinkOut - more resources
Full Text Sources
Medical
Research Materials
Miscellaneous


