Towards reproducible descriptions of neuronal network models
- PMID: 19662159
- PMCID: PMC2713426
- DOI: 10.1371/journal.pcbi.1000456
Towards reproducible descriptions of neuronal network models
Abstract
Progress in science depends on the effective exchange of ideas among scientists. New ideas can be assessed and criticized in a meaningful manner only if they are formulated precisely. This applies to simulation studies as well as to experiments and theories. But after more than 50 years of neuronal network simulations, we still lack a clear and common understanding of the role of computational models in neuroscience as well as established practices for describing network models in publications. This hinders the critical evaluation of network models as well as their re-use. We analyze here 14 research papers proposing neuronal network models of different complexity and find widely varying approaches to model descriptions, with regard to both the means of description and the ordering and placement of material. We further observe great variation in the graphical representation of networks and the notation used in equations. Based on our observations, we propose a good model description practice, composed of guidelines for the organization of publications, a checklist for model descriptions, templates for tables presenting model structure, and guidelines for diagrams of networks. The main purpose of this good practice is to trigger a debate about the communication of neuronal network models in a manner comprehensible to humans, as opposed to machine-readable model description languages. We believe that the good model description practice proposed here, together with a number of other recent initiatives on data-, model-, and software-sharing, may lead to a deeper and more fruitful exchange of ideas among computational neuroscientists in years to come. We further hope that work on standardized ways of describing--and thinking about--complex neuronal networks will lead the scientific community to a clearer understanding of high-level concepts in network dynamics, and will thus lead to deeper insights into the function of the brain.
Conflict of interest statement
EN and HEP are paid employees of the Norwegian University of Life Sciences. M-OG is a paid employee of Honda Research Institute Europe GmbH.
Figures


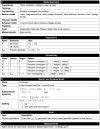
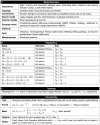
 external Poisson inputs (PG) to each neuron, and single lines are used instead of double lines.


 ). Connections are created by centering the mask about each location in the layer and drawing connections according to the probability distribution. Outgoing arrows indicate projections to other populations. Projection masks are scaled down in size to fit all projections into the layer, and grayscales have been adjusted for visibility. Connections are placed to correspond to the layout of panel B: Connections to and from thalamus are at the bottom, connections to and from Vp(v)LI(i) and Vp(h) to the right and connections to and from Vp(v)LS and Vp(v)L4 at the top.
Similar articles
-
Connectivity concepts in neuronal network modeling.PLoS Comput Biol. 2022 Sep 8;18(9):e1010086. doi: 10.1371/journal.pcbi.1010086. eCollection 2022 Sep. PLoS Comput Biol. 2022. PMID: 36074778 Free PMC article. Review.
-
NeuroML: a language for describing data driven models of neurons and networks with a high degree of biological detail.PLoS Comput Biol. 2010 Jun 17;6(6):e1000815. doi: 10.1371/journal.pcbi.1000815. PLoS Comput Biol. 2010. PMID: 20585541 Free PMC article.
-
Creating, documenting and sharing network models.Network. 2012;23(4):131-49. doi: 10.3109/0954898X.2012.722743. Epub 2012 Sep 20. Network. 2012. PMID: 22994683 Review.
-
Computational neuroscience and neuroinformatics: Recent progress and resources.J Biosci. 2018 Dec;43(5):1037-1054. J Biosci. 2018. PMID: 30541962 Review.
-
Computational neuroscience: beyond the local circuit.Curr Opin Neurobiol. 2014 Apr;25:xiii-xviii. doi: 10.1016/j.conb.2014.02.002. Epub 2014 Mar 3. Curr Opin Neurobiol. 2014. PMID: 24602868 Review.
Cited by
-
Reconciliation of weak pairwise spike-train correlations and highly coherent local field potentials across space.Cereb Cortex. 2024 Oct 3;34(10):bhae405. doi: 10.1093/cercor/bhae405. Cereb Cortex. 2024. PMID: 39462814 Free PMC article.
-
Multi-scale spiking network model of human cerebral cortex.Cereb Cortex. 2024 Oct 3;34(10):bhae409. doi: 10.1093/cercor/bhae409. Cereb Cortex. 2024. PMID: 39428578 Free PMC article.
-
A comprehensive data-driven model of cat primary visual cortex.PLoS Comput Biol. 2024 Aug 21;20(8):e1012342. doi: 10.1371/journal.pcbi.1012342. eCollection 2024 Aug. PLoS Comput Biol. 2024. PMID: 39167628 Free PMC article.
-
Multiscale co-simulation design pattern for neuroscience applications.Front Neuroinform. 2024 Feb 12;18:1156683. doi: 10.3389/fninf.2024.1156683. eCollection 2024. Front Neuroinform. 2024. PMID: 38410682 Free PMC article.
-
Metamodelling of a two-population spiking neural network.PLoS Comput Biol. 2023 Nov 30;19(11):e1011625. doi: 10.1371/journal.pcbi.1011625. eCollection 2023 Nov. PLoS Comput Biol. 2023. PMID: 38032904 Free PMC article.
References
-
- Gopen GD, Swan JA. The science of scientific writing. American Scientist. 1990;78:550–558.
-
- Rotter S, Diesmann M. Exact digital simulation of time-invariant linear systems with applications to neuronal modeling. Biol Cybern. 1999;81:381–402. - PubMed
-
- Brunel N. Dynamics of sparsely connected networks of excitatory and inhibitory spiking neurons. J Comput Neurosci. 2000;8:183–208. - PubMed
-
- Destexhe A, Bal T, McCormick DA, Sejnowski TJ. Ionic mechanisms underlying synchronized oscillations and propagating waves in a model of ferret thalamic slices. J Neurophysiol. 1996;76:2049–2070. - PubMed
-
- Haeusler S, Maass W. A statistical analysis of information-processing properties of laminaspecific cortical microcircuit models. Cereb Cortex. 2007;17:149–162. - PubMed
Publication types
MeSH terms
LinkOut - more resources
Full Text Sources


