Characterization of Gaucher disease bone marrow mesenchymal stromal cells reveals an altered inflammatory secretome
- PMID: 19587377
- PMCID: PMC2925728
- DOI: 10.1182/blood-2009-02-205708
Characterization of Gaucher disease bone marrow mesenchymal stromal cells reveals an altered inflammatory secretome
Abstract
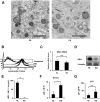
Gaucher disease causes pathologic skeletal changes that are not fully explained. Considering the important role of mesenchymal stromal cells (MSCs) in bone structural development and maintenance, we analyzed the cellular biochemistry of MSCs from an adult patient with Gaucher disease type 1 (N370S/L444P mutations). Gaucher MSCs possessed a low glucocerebrosidase activity and consequently had a 3-fold increase in cellular glucosylceramide. Gaucher MSCs have a typical MSC marker phenotype, normal osteocytic and adipocytic differentiation, growth, exogenous lactosylceramide trafficking, cholesterol content, lysosomal morphology, and total lysosomal content, and a marked increase in COX-2, prostaglandin E2, interleukin-8, and CCL2 production compared with normal controls. Transcriptome analysis on normal MSCs treated with the glucocerebrosidase inhibitor conduritol B epoxide showed an up-regulation of an array of inflammatory mediators, including CCL2, and other differentially regulated pathways. These cells also showed a decrease in sphingosine-1-phosphate. In conclusion, Gaucher disease MSCs display an altered secretome that could contribute to skeletal disease and immune disease manifestations in a manner distinct and additive to Gaucher macrophages themselves.
Figures


Comment in
-
Mesenchymal gaucho homing on the range.Blood. 2009 Oct 8;114(15):3134-5. doi: 10.1182/blood-2009-07-233601. Blood. 2009. PMID: 19815677
Similar articles
-
Alpha-synuclein interacts with Glucocerebrosidase providing a molecular link between Parkinson and Gaucher diseases.J Biol Chem. 2011 Aug 12;286(32):28080-8. doi: 10.1074/jbc.M111.237859. Epub 2011 Jun 8. J Biol Chem. 2011. PMID: 21653695 Free PMC article.
-
Macrophages exposed in vitro to conduritol B epoxide resemble Gaucher cells.Exp Mol Pathol. 1988 Jun;48(3):317-23. doi: 10.1016/0014-4800(88)90068-8. Exp Mol Pathol. 1988. PMID: 3371456
-
Phosphatidylcholine synthesis is elevated in neuronal models of Gaucher disease due to direct activation of CTP:phosphocholine cytidylyltransferase by glucosylceramide.FASEB J. 2002 Nov;16(13):1814-6. doi: 10.1096/fj.02-0149fje. Epub 2002 Sep 5. FASEB J. 2002. PMID: 12223447
-
Gaucher disease among Chinese patients: review on genotype/phenotype correlation from 29 patients and identification of novel and rare alleles.Blood Cells Mol Dis. 2007 May-Jun;38(3):287-93. doi: 10.1016/j.bcmd.2006.11.003. Epub 2006 Dec 29. Blood Cells Mol Dis. 2007. PMID: 17196853 Review.
-
Lysosomal integral membrane protein-2: a new player in lysosome-related pathology.Mol Genet Metab. 2014 Feb;111(2):84-91. doi: 10.1016/j.ymgme.2013.12.005. Epub 2013 Dec 11. Mol Genet Metab. 2014. PMID: 24389070 Free PMC article. Review.
Cited by
-
Old disease-New reflections: Gaucher, immunity, and inflammation.J Cell Mol Med. 2024 Oct;28(20):e70087. doi: 10.1111/jcmm.70087. J Cell Mol Med. 2024. PMID: 39463025 Free PMC article. Review.
-
Machine Learning-Driven Biomarker Discovery for Skeletal Complications in Type 1 Gaucher Disease Patients.Int J Mol Sci. 2024 Aug 6;25(16):8586. doi: 10.3390/ijms25168586. Int J Mol Sci. 2024. PMID: 39201273 Free PMC article.
-
The Expression and Secretion Profile of TRAP5 Isoforms in Gaucher Disease.Cells. 2024 Apr 20;13(8):716. doi: 10.3390/cells13080716. Cells. 2024. PMID: 38667330 Free PMC article.
-
Fabry Disease: Cardiac Implications and Molecular Mechanisms.Curr Heart Fail Rep. 2024 Apr;21(2):81-100. doi: 10.1007/s11897-024-00645-1. Epub 2024 Jan 30. Curr Heart Fail Rep. 2024. PMID: 38289538 Free PMC article. Review.
-
Genetics of enzymatic dysfunctions in metabolic disorders and cancer.Front Oncol. 2023 Aug 2;13:1230934. doi: 10.3389/fonc.2023.1230934. eCollection 2023. Front Oncol. 2023. PMID: 37601653 Free PMC article. Review.
References
-
- Grabowski GA, Beutler E. Gaucher disease. In: Scriver CR, Beaudet AL, Sly WS, et al., editors. The Online Metabolic and Molecular Bases of Inherited Disease. New York, NY: McGraw-Hill; 2009.
-
- Yoshino M, Watanabe Y, Tokunaga Y, et al. Roles of specific cytokines in bone remodeling and hematopoiesis in Gaucher disease. Pediatr Int. 2007;49(6):959–965. - PubMed
-
- van Breemen MJ, de Fost M, Voerman JSA, et al. Increased plasma macrophage inflammatory protein (MIP)-1alpha and MIP-1beta levels in type 1 Gaucher disease. Biochim Biophys Acta. 2007;1772(7):788–796. - PubMed
-
- Boven LA, van Meurs M, Boot RG, et al. Gaucher cells demonstrate a distinct macrophage phenotype and resemble alternatively activated macrophages. Am J Clin Pathol. 2004;122(3):359–369. - PubMed
Publication types
MeSH terms
Substances
Grants and funding
LinkOut - more resources
Full Text Sources
Other Literature Sources
Medical
Research Materials


