Systematic evaluation of objective functions for predicting intracellular fluxes in Escherichia coli
- PMID: 17625511
- PMCID: PMC1949037
- DOI: 10.1038/msb4100162
Systematic evaluation of objective functions for predicting intracellular fluxes in Escherichia coli
Abstract
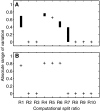
To which extent can optimality principles describe the operation of metabolic networks? By explicitly considering experimental errors and in silico alternate optima in flux balance analysis, we systematically evaluate the capacity of 11 objective functions combined with eight adjustable constraints to predict (13)C-determined in vivo fluxes in Escherichia coli under six environmental conditions. While no single objective describes the flux states under all conditions, we identified two sets of objectives for biologically meaningful predictions without the need for further, potentially artificial constraints. Unlimited growth on glucose in oxygen or nitrate respiring batch cultures is best described by nonlinear maximization of the ATP yield per flux unit. Under nutrient scarcity in continuous cultures, in contrast, linear maximization of the overall ATP or biomass yields achieved the highest predictive accuracy. Since these particular objectives predict the system behavior without preconditioning of the network structure, the identified optimality principles reflect, to some extent, the evolutionary selection of metabolic network regulation that realizes the various flux states.
Figures


Comment in
-
Principles of optimal metabolic network operation.Mol Syst Biol. 2007;3:126. doi: 10.1038/msb4100169. Epub 2007 Jul 10. Mol Syst Biol. 2007. PMID: 17625514 Free PMC article. Review. No abstract available.
Similar articles
-
Multidimensional optimality of microbial metabolism.Science. 2012 May 4;336(6081):601-4. doi: 10.1126/science.1216882. Science. 2012. PMID: 22556256
-
Stoichiometric flux balance models quantitatively predict growth and metabolic by-product secretion in wild-type Escherichia coli W3110.Appl Environ Microbiol. 1994 Oct;60(10):3724-31. doi: 10.1128/aem.60.10.3724-3731.1994. Appl Environ Microbiol. 1994. PMID: 7986045 Free PMC article.
-
Prediction of metabolic fluxes by incorporating genomic context and flux-converging pattern analyses.Proc Natl Acad Sci U S A. 2010 Aug 17;107(33):14931-6. doi: 10.1073/pnas.1003740107. Epub 2010 Aug 2. Proc Natl Acad Sci U S A. 2010. PMID: 20679215 Free PMC article.
-
Flux analysis and control of the central metabolic pathways in Escherichia coli.FEMS Microbiol Rev. 1996 Dec;19(2):85-116. doi: 10.1111/j.1574-6976.1996.tb00255.x. FEMS Microbiol Rev. 1996. PMID: 8988566 Review.
-
Comparison and analysis of objective functions in flux balance analysis.Biotechnol Prog. 2014 Sep-Oct;30(5):985-91. doi: 10.1002/btpr.1949. Epub 2014 Jul 18. Biotechnol Prog. 2014. PMID: 25044958 Review.
Cited by
-
Quantitative principles of microbial metabolism shared across scales.Nat Microbiol. 2024 Aug;9(8):1940-1953. doi: 10.1038/s41564-024-01764-0. Epub 2024 Aug 6. Nat Microbiol. 2024. PMID: 39107418 Review.
-
Integrative in vivo analysis of the ethanolamine utilization bacterial microcompartment in Escherichia coli.mSystems. 2024 Aug 20;9(8):e0075024. doi: 10.1128/msystems.00750-24. Epub 2024 Jul 18. mSystems. 2024. PMID: 39023255 Free PMC article.
-
Discretised Flux Balance Analysis for Reaction-Diffusion Simulation of Single-Cell Metabolism.Bull Math Biol. 2024 Mar 6;86(4):39. doi: 10.1007/s11538-024-01264-6. Bull Math Biol. 2024. PMID: 38448618 Free PMC article.
-
Integration of graph neural networks and genome-scale metabolic models for predicting gene essentiality.NPJ Syst Biol Appl. 2024 Mar 6;10(1):24. doi: 10.1038/s41540-024-00348-2. NPJ Syst Biol Appl. 2024. PMID: 38448436 Free PMC article.
-
2'-Fucosyllactose helps butyrate producers outgrow competitors in infant gut microbiota simulations.iScience. 2024 Feb 3;27(3):109085. doi: 10.1016/j.isci.2024.109085. eCollection 2024 Mar 15. iScience. 2024. PMID: 38380251 Free PMC article.
References
-
- Aebersold R, Mann M (2003) Mass spectrometry-based proteomics. Nature 422: 198–207 - PubMed
-
- Almaas E, Kovacs B, Vicsek T, Oltavi ZN, Barabasi AL (2004) Global organization of metabolic fluxes in the bacterium Escherichia coli. Nature 427: 839–843 - PubMed
-
- Bailey JE (2001) Complex biology with no parameters. Nat Biotechnol 19: 503–504 - PubMed
Publication types
MeSH terms
Substances
LinkOut - more resources
Full Text Sources


