iBet uBet web content aggregator. Adding the entire web to your favor.


Link to original content: http://www.ncbi.nlm.nih.gov/pubmed/15157274
The functional organization of mitochondrial genomes in human cells - PubMed Skip to main page content
U.S. flag

An official website of the United States government

Dot gov

The .gov means it’s official.
Federal government websites often end in .gov or .mil. Before sharing sensitive information, make sure you’re on a federal government site.

Https

The site is secure.
The https:// ensures that you are connecting to the official website and that any information you provide is encrypted and transmitted securely.

Access keys NCBI Homepage MyNCBI Homepage Main Content Main Navigation
. 2004 May 24:2:9.
doi: 10.1186/1741-7007-2-9.

The functional organization of mitochondrial genomes in human cells

Affiliations

The functional organization of mitochondrial genomes in human cells

Francisco J Iborra et al. BMC Biol. .

Abstract

Background: We analyzed the organization and function of mitochondrial DNA in a stable human cell line (ECV304, which is also known as T-24) containing mitochondria tagged with the yellow fluorescent protein.

Results: Mitochondrial DNA is organized in approximately 475 discrete foci containing 6-10 genomes. These foci (nucleoids) are tethered directly or indirectly through mitochondrial membranes to kinesin, marked by KIF5B, and microtubules in the surrounding cytoplasm. In living cells, foci have an apparent diffusion constant of 1.1 x 10(-3) microm2/s, and mitochondria always split next to a focus to distribute all DNA to one daughter. The kinetics of replication and transcription (monitored by immunolabelling after incorporating bromodeoxyuridine or bromouridine) reveal that each genome replicates independently of others in a focus, and that newly-made RNA remains in a focus (residence half-time approximately 43 min) long after it has been made. This mitochondrial RNA colocalizes with components of the cytoplasmic machinery that makes and imports nuclear-encoded proteins - that is, a ribosomal protein (S6), a nascent peptide associated protein (NAC), and the translocase in the outer membrane (Tom22).

Conclusions: The results suggest that clusters of mitochondrial genomes organize the translation machineries on both sides of the mitochondrial membranes. Then, proteins encoded by the nuclear genome and destined for the mitochondria will be made close to mitochondrial-encoded proteins so that they can be assembled efficiently into mitochondrial complexes.


Figures
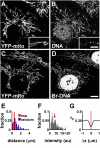
Figure 1
Figure 1
DNA in the mitochondria of fixed ECV-304 cells expressing subunit VIII of cytochrome oxidase tagged with YFP. (A,B) Two views taken with a confocal microscope of fixed cells after immunolabelling DNA. Mitochondria marked with YFP (A) contain discrete foci of mtDNA (B); nuclear DNA appears weakly labelled, presumably because most of it is inaccessible to the anti-DNA antibody, an IgM. Pretreatment (60 min; 20°C) with 25 μg/ml DNase removed >96% foci like those in (B). Insets: high-power views (bar: 2 μm). (C,D) Two similar views after growth (24 h) in BrdU, and immunolabelling the resulting Br-DNA; Br-DNA is found in nuclei and mitochondrial foci. Bar: 4 μm. (E) The distribution seen experimentally (exp) of distances between consecutive DNA foci within mitochondria (determined using images like (B); n > 500) differs significantly from a random one (p = 0.0013); foci tend to be closer together than expected. Distances (μm) are binned (that is, 0–0.4, 0.4–0.8, etc). (F) Experimental distribution (determined using 15 images like (D)) of intensities of mtDNA foci. Intensities (arbitrary units, au) are binned (that is, 0–0.5, 0.5–1, etc), the first bin contained no examples, and the arrow marks the average intensity. If the weakest focus (in bin 2) contains one genome, then the average contains ~9.2. (G) Cross-correlation analysis of mtDNA foci and the YFP-tagged subunit (using images like those in the insets in (A,B)); the low Pearson's coefficient (rP) at Δx values close to zero indicates that mtDNA is excluded from sites containing YFP.
Figure 2
Figure 2
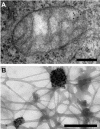
Electron microscopy reveals mitochondrial DNA in discrete foci. Bars: 200 nm. (A) Cytoplasmic section after immunogold labelling with anti-DNA; gold particles marking mtDNA are found near the mitochondrial membrane. (B) Whole mount view of cytoplasm after extraction with CSK buffer and immunogold labelling with anti-DNA; mtDNA (marked by gold particles) resists extraction.
Figure 3
Figure 3
mtDNA associates with tubulin and a kinesin subunit (KIF5B). Cells with YFP-tagged mitochondria were fixed, various targets immunolabelled and imaged in the confocal microscope. (A-D) Four views of one region of the cytoplasm; mtDNA foci are found in mitochondria that are generally aligned with microtubules (mtDNA and tubulin are pseudocoloured green and red in the merge in (D)). Bar: 2 μm. (E-G) Three views of one region of the cytoplasm; mtDNA foci often lie near KIF5B (pseudocoloured red and green in the merge in (G)). Bar: 1 μm. (H) The high Pearson's coefficient (rP) at Δx values close to zero indicates that mtDNA lies near KIF5B.
Figure 4
Figure 4
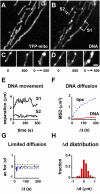
mtDNA dynamics in living cells with YFP-tagged mitochondria. Cells were grown (30 min) in 0.1 μg/ml ethidium, the ethidium washed away, the cells regrown for 10 min, and single confocal sections collected every 10 sec for ≤500 sec; mitochondria and mtDNA are marked by YFP and ethidium respectively. (A,B) Two views of mitochondria in one cell at one time. Ethidium is locally concentrated in (mtDNA) foci, against a background (bound to RNA). S1: distance between two foci. S2: distance between one focus and mitochondrial tip. (C,D) Frames showing ethidium fluorescence (marking mtDNA) from two movies. In each case, the first (0 sec; left) and last (500 sec; middle) frames show the two mtDNA foci move little relative to each other; this is confirmed by superimposing all frames in each movie (right). Bar: 2 μm. (E) Changes in separations S1 and S2 seen in (B) over time; movement is erratic. (F) Mean square displacement (MSD; n = 20) of one mt DNA focus relative to another (DNA), or one tip relative to another (tip); movement of foci is more restrained than that of tips. The MSD of one terminal focus relative to the tip is similar to that of one focus relative to another and is not shown. (G) Autocorrelation analysis. The autocorrelation (ac) between the displacement distances (Δd) for time points separated by different time intervals (Δt) of 10 sec (dashed lines show limits of 5% significance). The pattern is typical of a random walk; there is no periodicity, and the first value (the only significant one) is negative. (H) The distribution of step lengths (Δd) is typical of a random walk. Mean = 0.01 μm (SD ± 0.4). The maximum value was 2.4 μm, and is not shown.
Figure 5
Figure 5
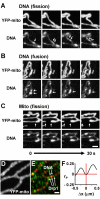
Fusion and fission of mitochondria and mtDNA foci. (A-C) Four pairs of frames (collected at 10 s intervals) from three movies of living cells (made as in Figure 4A,4B) showing YFP and ethidium fluorescence (marking mitochondria and mtDNA, respectively) are illustrated. Arrows mark a mtDNA focus that splits (A), two foci that fuse (B), and the point where a mitochondrion splits next to one mtDNA focus to give two separate tips (C). Bar: 1 μm. (D-F) Cells with YFP-tagged mitochondria were fixed, DNA and Drp1 immunolabelled with Cy5 and Cy3, and imaged; two views of one cell are shown in (D) and (E). In the merge (E), mtDNA often lies next to Drp1, which is also found in the cytoplasm [34]. Bar: 1 μm. A cross-correlation analysis of the distribution of mtDNA and Drp1 (data from 15 images like those in (D,E)); Pearson's coefficient (rP) indicates that Drp1 is excluded from ~0.3 μm to each side of mtDNA foci (F).
Figure 6
Figure 6
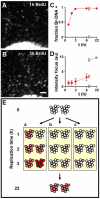
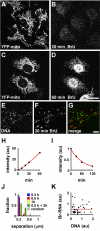
Mitochondrial replication. Cells with YFP-tagged mitochondria were grown in BrdU for 1–6 h, fixed, and Br-DNA immunolabelled. (A,B) On growth in BrdU, progressively more mitochondrial foci containing Br-DNA are seen. Bar: 2 μm. (C) Changes in the fraction of DNA foci containing Br-DNA (assuming cells contain 468 foci/cell; Table 1, line 3); essentially all foci contain Br-DNA within 3 h. (D) Integrated intensity of Br-DNA labelling per focus (in arbitrary units, with the value at 1 h set to unity). The average intensity per focus is constant between 1 and 2 h, and then rises; extrapolating the line from 2–6 h to 22 h (the length of the cell cycle) gives an intensity of 10 (square). (E) Three models for replication. Two DNA foci, each initially containing 10 unreplicated genomes (open circles), are shown. (a) Here, a focus is a unit of replication. In the first hour, all genomes in one focus replicate together (red circles) and half the foci become labelled (as in Figure 6C); in the second hour, all genomes in a second focus replicate together so that all genomes are now labelled (again as in Figure 6C). However, during the third hour, the intensity of foci continues to increase (Figure 6D), so we would have to assume that genomes re-replicate (dark red circles) and some would presumably have to be degraded to maintain genome numbers. (b) All genomes replicate independently of all others. The kinetics in (D) and (E) are consistent with this model. (c) Here, a polymerizing complex transfers from genome to genome in one focus before going to another focus; then genomes in one focus would replicate successively, before replication switched to another focus. This would give the progressive increase seen in Figure 6D, but many foci would remain unlabelled after 2 h (which is inconsistent with Figure 6E).
Figure 7
Figure 7
Mitochondrial transcription. Cells with YFP-tagged mitochondria were grown in 2.5 mM BrU for different times, fixed, Br-RNA immunolabelled with Cy3, and confocal images collected. In some cases, cells were grown for 30 min, washed, and regrown in 5 mM U for up to 2 h (I,J); in others, DNA was immunolabelled with Cy5 (E-G,J) or stained with Hoechst 33342 (K). (A,B) Two views of one field; after growth in BrU for 20 min, Br-RNA is seen mainly in mitochondria. (C,D) Two views of one field; after growth in BrU for 60 min, Br-RNA is seen mainly in nuclei. Bar: 10 μm. (E-G) Three views of mitochondria of one cell, after growth in BrU for 30 min and immunolabelling DNA with Cy5; the merge reveals Br-RNA (red) in some, but not all, mtDNA foci (green). Bar: 2 μm. (H) On growth in BrU, the intensity of Br-RNA labelling (arbitrary units/μm2) in mitochondria increases progressively. (I) After growth for 30 min in BrU and regrowth in U, the intensity of mitochondrial Br-RNA labelling falls exponentially (red line; t1/2 ~ 45 min). (J) The effects of incubation time on distance between a Br-RNA focus and the nearest mtDNA focus. Distances (μm) are binned (that is, 0–0.2, 0.2–0.4, etc). After 20 or 30 min in BrU, most Br-RNA foci lie between 0–0.2 μm of the nearest mtDNA foci (labelled with Cy5); however, after 1 h (or a 30 min pulse followed by a 2 h chase), Br-RNA foci appear to be spread randomly. The decline in Br-RNA colocalizing with mtDNA (that is, lying within 0.2 μm) between 20 and 60 min is consistent with a residence half-life of 43 min. (K) After growth in BrU for 30 min, the intensity of labelling in a Br-RNA focus (au, arbitrary units) does not correlate with the DNA concentration seen in the associated mtDNA focus. The line (slope = 0.0042) is that of best fit. In an analogous experiment in which mtDNA was marked with the antibody, the line of best fit had a similar slope of 0.0068.
Figure 8
Figure 8
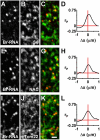
Localization of the cytoplasmic translation and mitochondrial import machinery relative to newly-made mitochondrial transcripts. Cells were grown in BrU for 30 min, fixed, Br-RNA plus different targets immunolabelled, and confocal images collected. Under the conditions used, little Br-RNA made in the nucleus has time to reach the cytoplasm [39]. (A-C) Three views of one field; newly-made mitochondrial Br-RNA is found near S6, a constituent of the cytoplasmic ribosome (shown as red and green in the merge in (C), respectively). (D) The high Pearson's coefficient (rP) at Δx values close to zero confirms that Br-RNA is often found near S6. (E-L) As (A-D); newly-made mitochondrial Br-RNA is also found near the α subunit of NAC (a cytoplasmic chaperone), and Tom22 (a component of the mitochondrial import machinery). Bar: 1 μm.
Figure 9
Figure 9
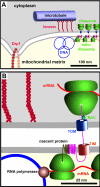
A cartoon illustrating the components studied here (drawn roughly to scale) that lie within the sphere of influence of mtDNA. (A) A cluster of approximately eight mitochondrial genomes (see Table 1; only three are shown) are tethered through the mitochondrial membranes (see Figure 2) to kinesin and cytoplasmic microtubular network (see Figure 3); tethering restricts motion (see Figure 4), but the molecular mechanism is unknown. A cluster is usually found in a thin part of the mitochondrion poor in YFP-cytochrome oxidase (Figure 1G), and mitochondria generally split near Drp1 foci lying ~300 nm away (Figure 5). (B) A high-power view of a region in (A). Nascent mtRNA is translated cotranscriptionally by mitochondrial ribosomes bound both to the polymerase [40] and the inner mitochondrial membrane [57]; completed mRNAs (not shown) are also translated during most of their lifetime in this region (Figure 7J). The cytoplasmic translation machinery that makes nuclear-encoded proteins destined for the mitochondrion – marked by a ribosomal protein (S6) and a chaperone (NAC) – lie immediately on the other side of the mitochondrial membrane (Figure 8A,8B,8C,8D,8E,8F,8G,8H). Here, a cytoplasmic peptide is being made and imported through the translocases in the outer and inner membranes (TOM and TIM; TOM is marked by Tom22; Figure 8I,8J,8K,8L) where it will assemble with a mitochondrial-encoded peptide in the inner mitochondrial membrane. The close proximity of the two sets of machinery on each side of the membranes ensures efficient assembly of mitochondrial complexes containing proteins encoded by nuclear and mitochondrial genomes.

Similar articles

Cited by

References

    1. Hermann GJ, Shaw JM. Mitochondrial dynamics in yeast. Annu Rev Cell Dev Biol. 1998;14:265–303. doi: 10.1146/annurev.cellbio.14.1.265. - DOI - PubMed
    1. Yaffe MP. The machinery of mitochondrial inheritance and behavior. Science. 1999;283:1493–1497. doi: 10.1126/science.283.5407.1493. - DOI - PubMed
    1. Otsuga D, Keegan BR, Brisch E, Thatcher JW, Hermann GJ, Bleazard W, Shaw JM. The dynamin-related GTPase, Dnm1p, controls mitochondrial morphology in yeast. J Cell Biol. 1998;143:333–349. doi: 10.1083/jcb.143.2.333. - DOI - PMC - PubMed
    1. Labrousse AM, Zappaterra MD, Rube DA, van der Bliek AM. C. elegans dynamin-related protein DRP-1 controls severing of the mitochondrial outer membrane. Mol Cell. 1999;4:815–826. - PubMed
    1. Santel A, Fuller MT. Control of mitochondrial morphology by a human mitofusin. J Cell Sci. 2001;114:867–874. - PubMed

Publication types

LinkOut - more resources