iBet uBet web content aggregator. Adding the entire web to your favor.


Link to original content: http://pubmed.ncbi.nlm.nih.gov/39543086/
Adipocyte associated glucocorticoid signaling regulates normal fibroblast function which is lost in inflammatory arthritis - PubMed Skip to main page content
U.S. flag

An official website of the United States government

Dot gov

The .gov means it’s official.
Federal government websites often end in .gov or .mil. Before sharing sensitive information, make sure you’re on a federal government site.

Https

The site is secure.
The https:// ensures that you are connecting to the official website and that any information you provide is encrypted and transmitted securely.

Access keys NCBI Homepage MyNCBI Homepage Main Content Main Navigation
. 2024 Nov 14;15(1):9859.
doi: 10.1038/s41467-024-52586-x.

Adipocyte associated glucocorticoid signaling regulates normal fibroblast function which is lost in inflammatory arthritis

Collaborators, Affiliations

Adipocyte associated glucocorticoid signaling regulates normal fibroblast function which is lost in inflammatory arthritis

Heather J Faust et al. Nat Commun. .

Abstract

Fibroblasts play critical roles in tissue homeostasis, but in pathologic states they can drive fibrosis, inflammation, and tissue destruction. Little is known about what regulates the homeostatic functions of fibroblasts. Here, we perform RNA sequencing and identify a gene expression program in healthy synovial fibroblasts characterized by enhanced fatty acid metabolism and lipid transport. We identify cortisol as the key driver of the healthy fibroblast phenotype and that depletion of adipocytes, which express high levels of Hsd11b1, results in loss of the healthy fibroblast phenotype in mouse synovium. Additionally, fibroblast-specific glucocorticoid receptor Nr3c1 deletion in vivo leads to worsened arthritis. Cortisol signaling in fibroblasts mitigates matrix remodeling induced by TNF and TGF-β1 in vitro, while stimulation with these cytokines represses cortisol signaling and adipogenesis. Together, these findings demonstrate the importance of adipocytes and cortisol signaling in driving the healthy synovial fibroblast state that is lost in disease.


Conflict of interest statement

Competing interests M.B.B. serves on the scientific advisory board for GlaxoSmithKline and as a consultant for Moderna and 4FO ventures. Consulting relates to programs specific to each company and does not directly relate to the research in this report. MBB is the founder of Mestag Therapeutics which is focused on fibroblast-mediated pathology but not directly related to the research in this report. The remaining authors declare no competing interests.

Figures

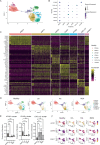
Fig. 1
Fig. 1. Single-cell RNA sequencing reveals distinct healthy and diseased cell populations in synovial tissue.
A H&E staining of synovial tissue sections highlighting broad histological differences among healthy, OA, and RA tissue, healthy n = 8, OA n = 2, RA n = 3 biological replicates, P = 0.001. Source images are in Supplemental Fig. 1a. B Left: Oil Red O staining of healthy synovium. Right: LipidTox neutral lipid staining of healthy and RA fibroblasts (live, CD45-, CD31- CD146- cells). CD36 is on the y axis. Healthy: n = 8, RA: n = 3 biological replicates, one independent experiment. P values were calculated using a two-tailed Student’s T test. C Immunofluorescence staining for PRG4 (purple), CD45 (red), PDPN (green), and DAPI (blue) in healthy, OA, and RA synovium. n = 3, biological replicates, one independent experiment. D Synovial cells from healthy, OA, and naive RA donors were harmonized and clustered into a single UMAP projection. E UMAP projection from (a) colored by correlation with rheumatoid arthritis (orange) or health (purple) using covarying neighborhood analysis (CNA). All data are presented as mean ± standard deviation. *P < 0.05, **P < 0.01, ***P < 0.001, ****P < 0.0001. Source data are provided as a Source Data file.
Fig. 2
Fig. 2. Synovial fibroblast signatures during homeostasis.
A Fine clustering analysis on healthy synovial fibroblasts defines seven distinct clusters. B Top markers of each fibroblast cluster. C Heatmap of the top 10 DEGs per cluster. D Symphony mapping of OA, naive RA, and remission (REM) fibroblasts to healthy synovial fibroblast reference. E Quantification of fibroblast proportions mapping to each cluster. Each data point represents a patient sample. Statistical comparisons: all groups were compared to healthy. Healthy: n = 10, OA: n = 9, RA: n = 26, REM: n = 3 biological samples. P values were calculated using an ordinary one-way ANOVA followed by Dunnet’s multiple comparison post hoc testing. F Healthy synovium is enriched in APOD, CEBPD, and NNMT expression compared to OA and RA fibroblasts, and is partially restored in remission fibroblasts. All data are presented as mean ± standard deviation. *P < 0.05, **P < 0.01, ***P < 0.001, ****P < 0.0001. Source data are provided as a Source Data file.
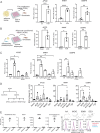
Fig. 3
Fig. 3. Search for active molecule driving healthy fibroblast cell state.
A Left: Schematic illustrating generation and application of fat-conditioned media (FCM). Created with Biorender. Right: FCM induces healthy fibroblast signature. n = 4 technical replicates, representative of two independent experiments. B Left: Schematic illustrating generation and application of adipocyte-conditioned media (ACM). Created with Biorender. Right: ACM induces the healthy fibroblast gene signature. n3 technical replicates, representative of two independent experiments. C Bligh and dyer separation of adipocyte-conditioned media (ACM). n = 3 technical replicates, representative of two independent experiments. D Left: Schematic detailing fractionation approach. ACM was separated using the Bligh and Dyer method into aqueous and organic phases. Then, the organic phase was taken for solid phase separation and eluted based on polarity using chloroform, acetone, methanol, and water. Right: Testing activity of each fraction. C, D Statistical comparisons: all groups were compared to basal/ctl. Basal: n = 6, ACM: n = 3, CHCL3: n = 5, Acetone: n = 5, Methanol: n = 5, H2O: n = 5 technical replicates, representative of two independent experiments. E MS intensity values were shown as the ion chromatogram areas extracted at m/z 303.233 ([M–H]-) for arachidonic acid (AA), m/z 356.070 ([M–H]-) for indomethacin (INDO), m/z 221.104 ([M–H]-) for isobutylmethylxanthine (IBMX), and m/z 437.198 ([M + COO]-) for dexamethasone in all three acetone fractions. n = 3 technical replicates of three SPE column purifications from one ACM, one independent experiment. All data are presented as mean ± standard deviation. A, B P values were calculated using a two-tailed Student’s T test; C, D were calculated using an ordinary one-way ANOVA followed by Dunnet’s multiple comparison post hoc testing. *P < 0.05, **P < 0.01, ***P < 0.001, ****P < 0.0001. Source data are provided as a Source Data file. A, B Created with BioRender.com released under a Creative Commons Attribution-NonCommercial-NoDerivs 4.0 International license (https://creativecommons.org/licenses/by-nc-nd/4.0/deed.en).
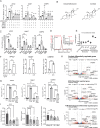
Fig. 4
Fig. 4. Glucocorticoid signaling is sufficient and necessary for healthy fibroblast phenotype.
A ACM media was tested in the presence or absence of adipocytes and the most enriched species: dexamethasone (DEX), indomethacin (INDO), insulin, or 3-isobutyl-1-methylxanthine (IBMX). n = 3 technical replicates, representative of one independent experiment. B Dexamethasone is a synthetic derivative of the naturally occurring glucocorticoid cortisol. Chemical structures are shown. C Bligh and dyer separation of fat-conditioned media (FCM), the active molecule is in organic and aqueous fractions of FCM. n = 3 technical replicates, representative of two independent experiments. D FCM contains cortisol, as measured by the positive mode mass spectrometry using cordisol-d4 as the internal standard, n = 7. E Approximate cortisol concentration in different FCM donors based on quantification of mass spectrometry data. Pre-adipocyte, D1, D3, 7289L, 7289R n = 5, D2, gout n = 4, technical replicates based on repeated measures of the same sample with different concentrations of deuterated standard added. F Cortisol, at biologically meaningful concentrations, is sufficient to induce healthy gene signature. n = 3, technical replicates, representative of two independent experiments. P values were calculated using a two-tailed Student’s T test. G CRISPR–cas9 knockdown of NR3C1, the gene encoding the glucocorticoid receptor (GCR), resulted in a dramatic reduction of fibroblasts to induce APOD, NNMT, and CEBPD expression in response to FCM. Non-targeting control (NTC) was used as a control. Two-way ANOVA was performed to calculate statistical significance. n = 3, technical replicates, representative of two independent experiments. H Volcano plots of genes up and downregulated by cortisol, FCM, and FCM+ the GCR antagonist mifepristone found by unbiased bulk RNA sequencing. Differentially expressed genes were calculated in DeSeq2, which calculates a P value using the Wald test. I Application of module scores to single-cell pseudobulk data (reads collapsed over patient). A Kruskal–Wallis test with Dunn’s multiple comparison post hoc test was used to calculate significance in (I). REM remission. Healthy: n = 10, OA: n = 9, RA: n = 25, REM: n = 3 biological replicates. P values for (A, C) were calculated using an ordinary one-way ANOVA followed by Dunnet’s multiple comparisons post hoc test. All data are presented as mean ± standard deviation. *P < 0.05, **P < 0.01, ***P < 0.001, ****P < 0.0001. Source data are provided as a Source Data file.
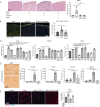
Fig. 5
Fig. 5. Glucocorticoid signaling is important for fibroblast homeostasis and arthritis severity.
A Adipocyte depletion over 8wks in knee joints of AdipoQ cre+ iDTR+ mice. n = 3 biological replicates, representative of one independent experiment. B Whole joint qPCR following adipocyte depletion. Ctl= AdipoQ cre- iDTR-, Depleted= AdipoQ cre+ iDTR + , in both cases the joint taken for qPCR was injected intra-articularly with diphtheria toxin over a time course of 8 weeks. Ctl n = 3, depleted n = 4 biological replicates, representative of one independent experiment. C Naive synovium in Pdgfra-CreER;Nr3c1fl/fl mice show decreased total Nr3c1 transcripts by qPCR as well as glucocorticoid-responsive genes compared to genotype controls. GT ctl n = 6, Pdgfra-CreER;Nr3c1fl/fl n = 5 biological replicates, representative of one independent experiment. D Flow cytometry of fibroblasts from naive synovium. GT ctl n = 6, Pdgfra-CreER;Nr3c1fl/fl n = 5 biological replicates, representative of two independent experiments. E Knee joint measurements of AIA Pdgfra-CreER;Nr3c1fl/fl mice. GT ctl n = 11, Pdgfra-CreER;Nr3c1fl/fl n = 13 biological replicates, representative of two independent experiments. GT ctl, PBS in black; GT ctl, mBSA in blue; Pdgfra-CreER;Nr3c1fl/fl PBS in green; Pdgfra-CreER;Nr3c1fl/fl mBSA in red. F Flow cytometry of synovium harvested day 11 post intra-articular mBSA injection. GT ctl n = 8, Pdgfra-CreER;Nr3c1fl/fl n = 8 biological replicates, representative of two independent experiments. AD P values were calculated using a two-tailed Student’s T test, E, F were calculated using a two-way ANOVA. All data are presented as mean ± standard deviation except (E), which is ±SEM. *P < 0.05, **P < 0.01, ***P < 0.001, ****P < 0.0001. Source data are provided as a Source Data file.
Fig. 6
Fig. 6. The synovium shares properties with adipose stromal cell populations.
A UMAP of PDGFRα+ stromal cells from human visceral and subcutaneous depots (VAT and SAT). B Bulk RNA sequencing defined cortisol, FCM, FCM + GCR ant, and TGF-β1 scores applied to adipose clusters. Fibroblasts from each donor were extracted and reads collapsed over donor and cluster to perform a pseudobulk analysis, meaning each data point represents the activation score of all of a donor’s fibroblasts, separated by cluster. A Kruskal–Wallis test with Dunn’s multiple comparison post hoc test was used to calculate significance. n = 28 biological samples. C Symphony UMAP with adipose stromal cells as a reference, quantification of mapping on right. Healthy n = 10, OA n = 9, RA n = 25, REM n = 3 biological samples. P values were calculated using an ordinary one-way ANOVA followed by Tukey’s multiple comparisons post hoc test. B, C Statistical comparisons: all groups were compared to each other. All data are presented as mean ± standard deviation. *P < 0.05, **P < 0.01, ***P < 0.001, ****P < 0.0001. Source data are provided as a Source Data file.
Fig. 7
Fig. 7. Functional effect of cortisol on fibroblasts.
A Left: FCM and cortisol (1 µM) protect against TNFa (2 ng/mL) and IFNy (25 ng/mL) induced matrix remodeling in long-term micromass culture (day 17). Cortisol and FCM were not added until day 7 of culture, TNFa and IFNy were added at day 0. n = 3 technical replicates, representative of one independent experiment. Right: MMP3 expression in 2D cultured synovial fibroblasts 24 h after addition of stimulation. n = 3 technical replicates, representative of one independent experiment. B Cortisol (1 µM) prevents TGF-β1 (10 ng/mL) induced fibrosis as measured by collagen 1a1 immunostaining (day 21). ImageJ quantification of COL1A1 staining on the right. FLS n = 5, TGFβ n = 8, TGF-β1+ cortisol n = 8 technical replicates, representative of one independent experiment. C Cortisol (100 nM) was applied to cells along with cytokines and assessed for APOD, CEBPD, and PLIN2 expression after 24 h. Concentrations used were: TNF (2 ng/mL), IFNy (25 ng/mL), TGF-β1 (10 ng/mL), IL1β (2 pg/mL) and IL17 (10 ng/mL). n = 3 technical replicates, representative of one independent experiment. Statistical comparisons: all groups were compared to the cortisol group. D Ability to enter adipogenic programs. Adipocyte differentiation media (ADM) was applied with or without 10 µM mifepristone (GCR antagonist). Day 9 qPCR, day 19 images (cultured until day 28). n = 3 technical replicates, representative of one independent experiment. Two-way ANOVA was performed to calculate statistical significance. E PLIN2 staining of micromass sections. Micromasses were treated with basal media, ADM, or ADM+ cytokines (TGFβ at 10 ng/mL or TNFa at 2 ng/mL+ IFNy at 25 ng/mL). ImageJ quantification of PLIN2 staining is on the right. Statistical comparisons: all groups were compared to the ADM group. n = 3 biological replicates, and two technical replicates within each sample (6 replicates per group total), representative of one independent experiment. A, B Statistical comparisons: all groups were compared to each other. A, B, D, E P values were calculated using an ordinary one-way ANOVA followed by Tukey’s multiple comparisons post hoc test; C P values were calculated using an ordinary one-way ANOVA followed by Dunnet’s multiple comparisons post hoc test. All data are presented as mean ± standard deviation. *P < 0.05, **P < 0.01, ***P < 0.001, ****P < 0.0001. Source data are provided as a Source Data file.

Update of

References

    1. Hitchon, C. A. & El-Gabalawy, H. S. The synovium in rheumatoid arthritis. Open Rheumatol. J.5, 107–114 (2011). - PMC - PubMed
    1. Zhang, F. et al. Defining inflammatory cell states in rheumatoid arthritis joint synovial tissues by integrating single-cell transcriptomics and mass cytometry. Nat. Immunol.20, 928–942 (2019). - PMC - PubMed
    1. Smith, M. D. The normal synovium. Open Rheumatol. J.5, 100–106 (2011). - PMC - PubMed
    1. Favero, M. et al. Infrapatellar fat pad features in osteoarthritis: a histopathological and molecular study. Rheumatology56, 1784–1793 (2017). - PubMed
    1. Kitagawa, T. et al. Histopathological study of the infrapatellar fat pad in the rat model of patellar tendinopathy: a basic study. Knee26, 14–19 (2019). - PubMed

MeSH terms

Substances

LinkOut - more resources