iBet uBet web content aggregator. Adding the entire web to your favor.


Link to original content: http://pubmed.ncbi.nlm.nih.gov/39317836/
Evolution of translational control and the emergence of genes and open reading frames in human and non-human primate hearts - PubMed Skip to main page content
U.S. flag

An official website of the United States government

Dot gov

The .gov means it’s official.
Federal government websites often end in .gov or .mil. Before sharing sensitive information, make sure you’re on a federal government site.

Https

The site is secure.
The https:// ensures that you are connecting to the official website and that any information you provide is encrypted and transmitted securely.

Access keys NCBI Homepage MyNCBI Homepage Main Content Main Navigation
Comparative Study
. 2024 Oct;3(10):1217-1235.
doi: 10.1038/s44161-024-00544-7. Epub 2024 Sep 24.

Evolution of translational control and the emergence of genes and open reading frames in human and non-human primate hearts

Affiliations
Comparative Study

Evolution of translational control and the emergence of genes and open reading frames in human and non-human primate hearts

Jorge Ruiz-Orera et al. Nat Cardiovasc Res. 2024 Oct.

Abstract

Evolutionary innovations can be driven by changes in the rates of RNA translation and the emergence of new genes and small open reading frames (sORFs). In this study, we characterized the transcriptional and translational landscape of the hearts of four primate and two rodent species through integrative ribosome and transcriptomic profiling, including adult left ventricle tissues and induced pluripotent stem cell-derived cardiomyocyte cell cultures. We show here that the translational efficiencies of subunits of the mitochondrial oxidative phosphorylation chain complexes IV and V evolved rapidly across mammalian evolution. Moreover, we discovered hundreds of species-specific and lineage-specific genomic innovations that emerged during primate evolution in the heart, including 551 genes, 504 sORFs and 76 evolutionarily conserved genes displaying human-specific cardiac-enriched expression. Overall, our work describes the evolutionary processes and mechanisms that have shaped cardiac transcription and translation in recent primate evolution and sheds light on how these can contribute to cardiac development and disease.


Conflict of interest statement

The authors declare no competing interests.

Figures
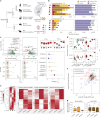
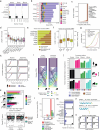
Fig. 1
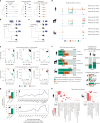
Fig. 1. Translational control across primate and mammalian adult hearts.
a, Estimated evolutionary distances and schematic of the biological LV replicates (nhuman = 15, nchimp = 5, nrhesus = 4, nmouse = 6 and nrat = 5). b, Number of transcribed and translated genes in LVs, divided by species and gene biotype. c, Top, distribution of TEvar compared to the levels of RNA-seq expression (log2 FPKM) and CDS length of each gene across human LVs. The right top box plot represents two hypothetical genes with low and high TEvar. Horizontal lines represent the average (non-dashed) and 5th and 95th percentiled (dashed) of TEvar. Specific gene groups based on different OXPHOS complexes are highlighted. Left bottom, box plots with TEvar for four quantile CDS groups based on the inter-species variance in CDS (CDSvar) or UTR length (UTRvar). Differences in TEvar across quantiles were significant for CDSvar (ANOVA, P = 1.3 × 10−7) and UTRvar (ANOVA, P = 6.9 × 10−4). Right bottom, dot plot with median TE variances for specific gene groups. Horizontal lines represent 95% CIs. d, Box plots with the distribution of normalized RNA-seq counts, Ribo-seq counts and TE for two genes with high TEvar. e, Heatmaps with scaled TE of 8,238 genes in the three primate species, including subsets of genes with species-specific TE changes. f, Differential RNA-seq and Ribo-seq expression between human and NHPs. Genes with human-specific regulation of translation (n = 465) are depicted in red, green or blue. Of these, 53.6% of genes were differentially expressed at the RNA-seq level and TE in opposite directions (buffering); 30.1% of the genes showed specific regulation at the Ribo-seq level (exclusive); and 16.3% of the genes displayed translational regulation that intensified the changes in transcript abundance (intensified). MYH7, MYL7 and six cardiac-enriched genes with human-specific TE changes are highlighted. g, Box plots with MYH7:MYH6 and MYL2:MYL7 ratios based on normalized Ribo-seq counts across primate LVs. In c, d and g, all biological replicates described in a were included, with boxes indicating interquartile range (IQR; 25th and 75th percentiles), center line indicating median and whiskers indicating minimum to maximum. Myr, million years. Source data
Fig. 2
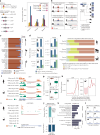
Fig. 2. Primate iPSC-CMs are models of fetal cardiac development.
a, Top, schematic of the iPSC differentiation protocol. BMP4 and Activin A were required only for rhesus iPSC differentiation (Methods). We generated five differentiation replicates for human and three differentiation replicates for chimpanzee, gorilla and rhesus. Bottom, immunocytochemistry of iPSC-CMs after 4 weeks of differentiation revealed expression of cardiac and CM markers. Merged images with 4′,6-diamidino-2-phenylindole (DAPI) counterstain (gray). Bar, 75 μm, being similar for all species. b, Left, schematic of the generated iPSC-CM samples, representing four primate species (human, chimpanzee, gorilla and rhesus macaque). Right, total number of transcribed and translated genes in iPSC-CMs, divided by species and gene biotype. Only genes transcribed in a minimum of three samples (FPKM ≥ 0.5) and an average FPKM ≥ 1 were selected. c,d, PCA of the mRNA abundance (c) and Ribo-seq occupancy (d) of 6,722 genes with robust mammalian orthologs across iPSCs, iPSC-CMs and adult LVs of the primate species. e, PCA of the mRNA abundance of iPSC-CMs, adult LVs and reanalyzed prenatal and postnatal LV data from Cardoso-Moreira et al.. f, Heatmap with scaled Ribo-seq counts for selected markers in all generated primate iPSC-CMs. Only defined consistent orthologous genes across primate species were considered (Methods). g, Dot plots with the log2 fold changes of gene transcription between adult LVs and iPSC-CMs (y axis) and between matched postnatal and prenatal heart samples (x axis) in the dataset from Cardoso-Moreira et al.. Cell-type-specific markers of the non-cardiomyocyte cardiac cell types are highlighted in different colors. Spearman’s rank correlation coefficients and one-sided P values are also displayed. FC, fold change; PC, principal component; QC, quality control; vSMC, vascular smooth muscle cell. aAnalysis performed using data from Cardoso-Moreira et al.. Source data
Fig. 3
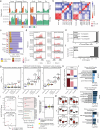
Fig. 3. Emergence of new genes across cardiac development.
ad, Schematic and estimated number of transcribed (b) and translated (c) evolutionarily young genes in human, chimpanzee and rhesus. Hominini refers to the lineage comprising both humans and chimpanzees. An example of an intronic hominini-specific gene antisense to MARCH11 is shown in d. Only species with both iPSC-CM and LV data are shown. The gene is not expressed in gorilla, mouse and rat. e, PCA of the transcript expression levels of evolutionarily young (top) and transcriptionally preserved (bottom) genes across iPSCs, iPSC-CMs and adult LVs. f, Percentages of preserved and young genes that are differentially transcribed between iPSC-CMs and adult LVs (left) or between prenatal and postnatal LVs (top right; data from Cardoso-Moreira et al.) across species, representing genes enriched prenatally and postnatally, respectively. Bottom right, percentages and numbers of young translated genes by directionality of regulation in transcription. g, Distribution of the ratios of the number of reads mapping to human and rhesus young genes for pooled iPSC-CM and adult LV datasets (left) and by developmental stage (analysis performed using data from Cardoso-Moreira et al.) (right). Vertical lines mark birth. h, Enriched CORUM and Gene Ontology terms of genes highly correlating to human and rhesus young genes in genome-wide gene–gene transcription correlations across cardiac development (analysis performed using data from Cardoso-Moreira et al.). PC, principal component; wpc, weeks post conception. Source data
Fig. 4
Fig. 4. Recent evolution of human cardiac-enriched genes.
a,b, Schematic and heatmap with the levels of tissue enrichment of genes with recently acquired enrichment of cardiac expression in humans (n = 76, analysis performed using data from Cardoso-Moreira et al.). Gene biotypes and cardiac/muscle specificity in GTEx are represented with different colors. c, Annotated functional descriptions and compiled evidence of functions or associations with cardiac function and disease for the 76 human cardiac-enriched genes. Only descriptions annotated for two or more genes in Ensembl version 98 are displayed. d, Heatmap with human cardiac-enriched genes that are enriched in different tissues in other non-human species (n = 27). Colors indicate the tissue that the gene is specific to. e, Expression of human CMAHP and the orthologous rhesus and mouse CMAH across different organs and developmental stages (analysis performed using data from Cardoso-Moreira et al.). Vertical lines mark birth. Human CMAHP recently acquired heart-enriched expression, whereas rhesus macaque and mouse CMAH is enriched in liver. Source data
Fig. 5
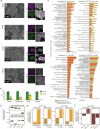
Fig. 5. Translation and evolution of sORFs across primate cardiac development.
a, Left, schematic of the sORF biotypes considered in this study. Right, number of replicated sORFs per species and biotype. b, Left, schematic of the evolutionary age of sORFs based on the presence or absence of translation across species and on the presence or absence of ORF structures for cases with young translation. Right, number of young sORFs with intact structure (blue), de novo structure (light blue) or without aligned counterpart sequences (orphan, in gray). c, Proportions of sORFs by biotype and age classification. Numbers of young sORFs are shown. d, Fraction of Ribo-seq reads mapped to sORFs in non-coding or protein-coding genes, separated by developmental stage, age and species. e, Percentages of young and preserved sORFs with similar or opposite direction of translational regulation between iPSC-CMs and adult LVs, compared to the transcription of their host genes. f, An example of a uORF upregulated in iPSC-CMs encoded by DEXI. Counts are normalized for visualization. g, Box plots with normalized expression levels of DEXI (RNA-seq) and its uORF (Ribo-seq) across human iPSC-CM (n = 5) and adult LV (n = 15) samples. Boxes indicate interquartile range (IQR; 25th and 75th percentiles); center line indicates median; and whiskers indicate minimum to maximum. h, Normalized RNA-seq expression levels of DEXI across human and rhesus cardiac developmental stages. Vertical lines mark birth. i, An example of a hominini-specific lncRNA-ORF encoded by the LINC01405 (or STRG-HSA-132505) gene. Counts are normalized for visualization. Because SRP14-AS1 did not result in any observable phenotype, we did not include this gene for visualization. j, Top, number of differentially expressed genes after perturbing LINC01405 and SRP14-AS1 expression with CRISPRi. Bottom, magnitude of change in expression of the target gene by CRISPRi for knockdown (KD). Both genes showed significant downregulation after KD: adjusted P = 3.7 × 10−4 and P = 2.6 × 10−6 for LINC01405 and SRP14-AS1, respectively. k, CORUM and Gene Ontology terms significantly enriched in the group of genes affected after genetic perturbation of LINC01405 in iPSC-CMs. CRISPRi, clustered regularly interspaced short palindromic repeats (CRISPR) interference. l, Fraction of young sORFs with predicted InterProScan motifs and ESMFold structures. DEG, differentially expressed gene; FC, fold change; GO:BP, Gene Ontology: Biological Proccess; GO:MF, Gene Ontology: Molecular Function. lncRNA-ORF, ORF in long non-coding RNA or unnanotated gene; ncRNA-ORF, ORF in non-coding RNA isoform; uoORF, upstream overlapping ORF; intORF, internal ORF; dORF, downstream ORF; doORF, downstream overlapping ORF. Source data
Fig. 6
Fig. 6. Dysregulation of recently evolved or recently enriched cardiac genes and sORFs in disease.
a, Fraction of ubiquitous preserved genes, preserved cardiac-enriched genes, recent cardiac-enriched genes and young genes that are differentially expressed in DCM in humans. b, Fraction of human sORFs with preserved or young translation and CDS that are differentially translated in DCM. c, Normalized RNA-seq expression levels of three example genes—GADD45G (recent cardiac-enriched expression in humans), LINC1405 (primate gene encoding a young sORF) and MARCH11-AS1 (young hominini gene encoding a young sORF; Fig. 3d)—in iPSC-CMs (n = 5), adult LVs (n = 15) and diseased DCM LVs (n = 65) (analysis performed using RNA-seq data from Van Heesch et al.) as well as across cardiac developmental stages (analysis performed using data from Cardoso-Moreira et al.). All samples per species represent biological replicates. Vertical lines represent birth. Boxes indicate interquartile range (IQR; 25th and 75th percentiles); center line indicates median; and whiskers indicate minimum to maximum. All genes are significantly dysregulated in DCM (GADD45G DESeq2 adjusted P = 0.0007; LINC01405 DESeq2 adjusted P = 0.0363; MARCH11-AS1 DESeq2 adjusted P = 0.0020). d, CHRNB1 contains a young translated uORF in a new primate-specific isoform with an extended 5′ UTR. P-site coverage of adult LVs for human, chimpanzee and rhesus is displayed. This uORF overlaps a ClinVar variant that deletes a CTC codon and is associated with congenital myasthenic syndrome 2A. e, RNA-seq expression of human SLC5A1 and orthologous rhesus and mouse genes across organs and developmental stages. Vertical lines mark birth. Human SLC5A1 recently acquired cardiac expression, whereas rhesus macaque and mouse SLC5A1 is expressed in the kidney. f, Exonic expression of SLC5A1 across human tissues in GTEx data. Tissues without detected expression are not displayed, except for the kidney. g, Exon 3 of SLC5A1 is cardiac specific and emerged in Old World monkeys; it is partially derived from an AluSz6 element and contains a translated de novo uORF in hominini. P-site coverage of adult LVs for human, chimpanzee and rhesus is displayed. Source data
Extended Data Fig. 1
Extended Data Fig. 1. Transcription and translation across adult hearts and iPSC-CMs.
a) Bar plots indicating the number of mapped RNA-seq and Ribo-seq reads per sample. b) Spearman correlations of gene FPKM values across RNA-seq and Ribo-seq samples. Only defined robust orthologous genes across all species were considered. c) Total number of assembled genes in pooled datasets of iPS cells, iPSC-CMs, and adult heart left ventricles (LV), divided by species and gene biotype. d) Distribution of Ribo-seq read periodicities between annotated start and stop codons for pooled iPSC-CM and LV samples in human, chimpanzee, gorilla, rhesus, and rodents (mouse and rat). The correct frame is displayed in red. e) Histogram depicting the number of human, chimp, and rhesus CDS sequences mappable by reads of 29 base pairs (the average size of ribosome-protected fragments) across the other primate genomes considered in the study. The accompanying text describes the count of CDS sequences that remain unmappable or unaligned to any other primate genome. f) Histogram illustrating the difference in length of CDS sequences shared by the identified homologous CDS across other primate genomes. g) Box plots displaying the median TE variances for each defined gene group following sample resampling (left, 10,000 iterations) or data downsampling (10,000 iterations with three samples per species, and 10,000 iterations with four samples species). In the left plot, adjusted FDR p-values represent if observed TE variation is higher than in resampled samples. In the middle and right plots, adjusted FDR p-values are calculated to evaluate if the observed TE variation is statistically different to the distribution of TE variances with an altered number of samples. Please see Methods for further information about the used statistical tests. h) Logarithmic ratio of median TE variances from genes from OXPHOS complexes V and IV, and essential genes, divided by all expressed genes in brain and heart. Brain data was retrieved from Wang et al. . Only human, rhesus, and mouse data was used to calculate TE variances. i) Pearson’s correlation of variances in TE and ratios of non-synonymous to synonymous substitutions (dN/dS) between human and mouse and human and rhesus for nuclear components of the Complex IV and V OXPHOS pathway. j) Dot plot with median mRNA abundance (RNA-seq) and ribosome occupancy (Ribo-seq) variances for specific gene groups. Boxes are grouped by species, representing biological LV replicates (nhuman = 15, nchimp = 5, nrhesus = 4, nmouse = 6, nrat = 5). Horizontal lines represent 95% confidence intervals. k) Box plots with logarithmic fold changes of TE between female (n = 7) and male (n = 8) human samples. None of the 465 genes whose TE were significantly up- or down-regulated in humans showed a significant difference in TE between both sexes. l) CORUM pathways and GO terms significantly enriched in the group of genes with significant differences in TE. Other comparisons did not result in enriched functions. m) Box plots with the distribution of TE values of six cardiac-enriched genes with significantly increased TE in humans versus non-human primates. Adjusted p-values are calculated by DESeq2. Boxes are grouped by species, representing biological LV replicates (nhuman = 15, nchimp = 5, nrhesus = 4). In panels g), k), and m), boxes indicate interquartile range (IQR; 25th and 75th percentiles); center line indicates median (50th percentile); whiskers indicate minimum to maximum. Source data
Extended Data Fig. 2
Extended Data Fig. 2. Validation of iPSC reprogramming and iPSC-CM differentiation.
a) Microscopy of human and NHP iPSCs by live-cell phase contrast (left column) and fixed-cell immunofluorescence following immunostaining against pluripotency-associated markers (right column). Bar = 250 μm (human, rhesus) and 210 μm (chimp, gorilla). b) Mean quantification of CM marker expression across iPSC-CMs at 4 weeks of differentiation. We included five independent differentiation replicates for human and three differentiation replicates for chimp, gorilla, and rhesus, error bars ± S.D. are represented. c) GO terms enriched in human genes upregulated in adult LV or iPSC-CMs, and/or in the corresponding pre- and postnatal developmental cardiac stages from Cardoso-Moreira et al. . The observed differences led to enrichments in similar functional pathways in both datasets, mostly related to mitochondrial functions, OXPHOS, and cell cycle. In contrast, enriched functions that were uniquely regulated in one dataset included cytoplasmic translation, RNA processing, or extracellular matrix organization, among others. d) Box plots with MYH7:MYH6 and TNII3:TNNI1 ratios based on the number of normalized Ribo-seq counts across primate iPSC-CMs. Boxes indicate interquartile range (IQR; 25th and 75th percentiles); center line indicates median (50th percentile); whiskers indicate minimum to maximum. We included five differentiation replicates for human and three differentiation replicates for chimp, gorilla, and rhesus. e) MYH7:MYH6 and TNII3:TNNI1 ratios for human and rhesus hearts based on normalized RNA-seq counts from the three earliest matching prenatal and three oldest postnatal samples from Cardoso-Moreira et al. . f) IRX4:NR2F2 ratios for human and rhesus iPSC-CMs and the three earliest matching prenatal hearts from Cardoso-Moreira et al. . Source data
Extended Data Fig. 3
Extended Data Fig. 3. Recent evolution of human cardiac-enriched genes.
a) Human adult LV (this study) and testis (Wang et al. ) Ribo-seq and RNA-seq profiles (left) and normalized RNA-seq expression levels across cardiac developmental stages (Analysis performed using data from Cardoso-Moreira et al. , right) of three genes with human-specific heart/muscle enrichment and with unknown cardiac function. Vertical lines mark birth. For CFAP61, only the 5′ region of the gene is represented. b) Genomic tracks of Ribo-seq, RNA-seq, RNA-seq junctions, and predicted open reading frames (ORFs) for the human pseudogene CMAHP and its orthologous protein-coding genes CMAH in chimp, rhesus, and mouse. Pooled data of LV samples are shown. c) TPM expression of CMAHP across human tissues in GTEx. Tissues are sorted by median TPM expression. d) Percentage of identity of predicted ORFs in CMAHP/CMAH across four species. Source data
Extended Data Fig. 4
Extended Data Fig. 4. Translation and evolution of sORFs during cardiac development.
a) Number of Ribo-seq reads mapped to features of protein-coding and non-coding genes (annotated and unannotated). b) Number of predicted ORFs per sample and dataset, divided by ORF biotype and including CDSs. c) Histogram depicting the number of human, chimp, and rhesus sORF sequences with young translation mappable by reads of 29 bp (average size of ribosome-protected fragments) across the other primate genomes considered in the study. The accompanying text describes the count of young sORFs that remain unmappable or unaligned to any other primate genome. d) Distribution of human sORF lengths for each biotype. e) Fractions of cognate (n = 905) and non-AUG (n = 1,358) human sORFs per ORF biotype. f) Distribution of human ORF lengths and P-sites per nucleotide for cognate and non-AUG sORFs. g) Cumulative density of the replicability of CDSs, cognate AUG sORFs, and non-AUG sORFs across human samples. h) Cumulative density of the fraction of intact frame in human recent and preserved sORFs with mutated or preserved initiation codon in the other species. i) Proportion of initiation codons in human ORFs with recent and preserved translation and their counterpart regions in rhesus. j) Fraction of counterpart ORF regions transcribed in other species based on RNA-seq data, divided by levels of ORF age. k) Top: Number of primate uORFs/uoORFs with or without preserved translation in other species. Bottom: Distribution of pairwise TE variance of human CDSs hosting uORFs/uoORFs preserved or not preserved in chimp or in rhesus. Two-sided Wilcoxon rank-sum test adjusted p-values are displayed. l) Number of sORFs tested in published CRISPR screens, including cases that showed a significant effect on cell viability. ORFs are separated by the age of translation. m) Number of predicted InterproScan motifs in sORFs by signature and species. n) Two examples of de novo sORFs with predicted alpha helices by ESMFold in human and rhesus. o) Fraction of shuffled amino acid sequences with predicted InterproScan motifs and ESMFold structures. In panels d), f), and k), boxes indicate interquartile range (IQR; 25th and 75th percentiles); center line indicates median ; whiskers indicate minimum to maximum. Source data
Extended Data Fig. 5
Extended Data Fig. 5. Dysregulation of recently evolved or recently enriched cardiac genes and sORFs in disease.
a) Left: Fraction of ubiquitous preserved genes, preserved cardiac-enriched genes, recent cardiac-enriched genes, and evolutionarily young genes that are differentially expressed in hypertrophic cardiomyopathy (HCM, 9 controls and 28 disease donors) in humans. Right: Correlation between the log2 FoldChanges of mRNA abundance between dilated cardiomyopathy (DCM) and controls, and between HCM and controls, for both analyzed cohorts. Spearman’s rank correlation coefficients by gene group are also displayed. b) Box plots with normalized RNA-seq expression values of seven selected genes in a cohort of 97 control and 108 dilated cardiomyopathy (DCM) donors (Biological replicates, analysis performed using data from Heinig et al. ). Boxes indicate interquartile range (IQR; 25th and 75th percentiles); center line indicates median (50th percentile); whiskers indicate minimum to maximum. MARCH11-AS1 is regulated in the same direction as its sense gene MARCH11, whereas SRP14-AS1 and its sense gene SRP14 show opposite regulation in DCM, pointing to different locus-specific regulatory mechanisms. Adjusted p-values are calculated by DESeq2. c) Box plots with normalized expression values of SLC5A1 in HCM and in a cohort of 15 control and 65 dilated cardiomyopathy (DCM) donors (Biological replicates, analysis performed using data from Van Heesch et al. ). Boxes indicate interquartile range (IQR; 25th and 75th percentiles); center line indicates median (50th percentile); whiskers indicate minimum to maximum. Adjusted p-values are calculated by DESeq2. d) Genomic tracks of Ribo-seq, RNA-seq, and RNA-seq junctions for SLC5A1 in human, chimp, gorilla, rhesus, mouse and rat. Pooled data of iPSC-CM and LV samples are shown. e) Pearson’s correlation of the Deseq2-normalized levels of ribosome occupancy between SLC5A1 uORF and CDS for iPSC-CM, adult LVs, and DCM samples. The uORF and the CDS show a significant positive one-sided correlation. Source data

Similar articles

References

    1. Shave, R. E. et al. Selection of endurance capabilities and the trade-off between pressure and volume in the evolution of the human heart. Proc. Natl Acad. Sci. USA116, 19905–19910 (2019). - PMC - PubMed
    1. Marlowe, F. W. Hunter-gatherers and human evolution. Evol. Anthropol.14, 54–67 (2005).
    1. Varki, N. et al. Heart disease is common in humans and chimpanzees, but is caused by different pathological processes. Evol. Appl.2, 101–112 (2009). - PMC - PubMed
    1. Lowenstine, L. J., McManamon, R. & Terio, K. A. Comparative pathology of aging great apes: bonobos, chimpanzees, gorillas, and orangutans. Vet. Pathol.53, 250–276 (2016). - PubMed
    1. Ferrández-Peral, L. et al. Transcriptome innovations in primates revealed by single-molecule long-read sequencing. Genome Res.32, 1448–1462 (2022). - PMC - PubMed

Publication types

LinkOut - more resources