iBet uBet web content aggregator. Adding the entire web to your favor.


Link to original content: http://pubmed.ncbi.nlm.nih.gov/39282335/
A Phylogenetic Model of Established and Enabled Biome Shifts - PubMed Skip to main page content
U.S. flag

An official website of the United States government

Dot gov

The .gov means it’s official.
Federal government websites often end in .gov or .mil. Before sharing sensitive information, make sure you’re on a federal government site.

Https

The site is secure.
The https:// ensures that you are connecting to the official website and that any information you provide is encrypted and transmitted securely.

Access keys NCBI Homepage MyNCBI Homepage Main Content Main Navigation
[Preprint]. 2024 Sep 2:2024.08.30.610561.
doi: 10.1101/2024.08.30.610561.

A Phylogenetic Model of Established and Enabled Biome Shifts

Affiliations

A Phylogenetic Model of Established and Enabled Biome Shifts

Sean W McHugh et al. bioRxiv. .

Abstract

Where each species actually lives is distinct from where it could potentially survive and persist. This suggests that it may be important to distinguish established from enabled biome affinities when considering how ancestral species moved and evolved among major habitat types. We introduce a new phylogenetic method, called RFBS, to model how anagenetic and cladogenetic events cause established and enabled biome affinities (or, more generally, other discrete realized versus fundamental niche states) to shift over evolutionary timescale. We provide practical guidelines for how to assign established and enabled biome affinity states to extant taxa, using the flowering plant clade Viburnum as a case study. Through a battery of simulation experiments, we show that RFBS performs well, even when we have realistically imperfect knowledge of enabled biome affinities for most analyzed species. We also show that RFBS reliably discerns established from enabled affinities, with similar accuracy to standard competing models that ignore the existence of enabled biome affinities. Lastly, we apply RFBS to Viburnum to infer ancestral biomes throughout the tree and to highlight instances where repeated shifts between established affinities for warm and cold temperate forest biomes were enabled by a stable and slowly-evolving enabled affinity for both temperate biomes.

Keywords: Bayesian inference; Viburnum; biome shift; niche evolution; phylogenetic model.


Figures

Figure 1:
Figure 1:
Cartoon of RFBS model events. This example shows an example character history from a typical biome shift model considering only biome established affinities and non-affinities, and a possible RFBS character history given the same established affinities on a toy phylogeny with three species and two biomes (cold: blue conifer in left cells; warm: red palm in right cells). A) A species has either an established affinity (purple text/arrows and colored tree), an enabled affinity (orange text/arrows and grayed-out tree), or a non-affinity, (blank tree) for each biome in the system. B) During cladogenesis, if a species has two or more biome affinities, they are inherited by daughter lineages in any of five ways, with the established affinity set either splitting or one daughter inheriting the full range while the other retains only a subset. Such cladogenetic events can act either only on the established affinities, with enabled affinities still being retained, or down to the enabled affinity, too. C) During anagenesis, species gain and lose affinities, as shown using a single cold temperate affinity. (D) Most models used to model biome shifts only consider biome occupancy, resulting in histories only for the gain and loss of established affinities. (E) RFBS may produce richer character histories with shifts in both established and enabled affinities.
Figure 2:
Figure 2:
Cartoon depicting how to score enabled biome affinities. A species might have an enable, established, or non-affinity for each of three biomes: temperate (conifer), warm temperate (plumeria), and tropical (palm) forests. A) Each species will have a true set of biome affinities. B) True established biome affinities are typically scored appropriately as established affinities, however enabled and non-affinities are difficult to score as most species are rarely observed outside of their native biomes. In these instances, such affinities are left ambiguous. In example B, we would assign equal probability to states 020, 021, 120, and 121. Additional information can be used to include or exclude enabled affinities for some biomes. C) This example uses the occurrence of the plant in a cold temperate arboretum to include a cold temperate biome affinity. The possible states under this scenario are 120 and 121. D) This example uses experimental data showing the plant requires prolonged freezing periods to germinate (i.e. double dormancy). The possible states under this scenario are 020 and 120.
Figure 3:
Figure 3:
Rate parameter coverage simulation experiment assessing parameter estimation accuracy for a 8-parameter RFBS model with five free parameters for rates and constrained three parameters for the probability of cladogenetic splitting events. Four simulation treatments of 100 datasets are shown for two treatments of tree size (Small Tree= 50 tips, Large Tree=500 tips) and mean biome shift rates(Slow=0.5, Fast=2.0). Points plotted on each graph are the posterior medians on the y axis and true parameter value on the x axis, with the arrows from each point showing the 50 percent HPD. Red lines indicate estimates where the true data generating parameters were not in the 50 percent HPD and blue indicates estimates that were. The number on the upper left corner of each plot indicates the percentage of 100 simulation trials where the true parameters fell within the 50 percent HPD. Blue for this number indicate the percent is within two standard deviations of the expected mean given the number of samples and percent expected. A) Small tree and slow rate treatment, B) Small tree and fast rate treatment, C) Large tree and slow rate treatment, D) Large tree and fast rate treatment.
Figure 4:
Figure 4:
Ancestral affinity accuracy for RFBS (blue boxes) and DEC (red boxes) simulations. Boxplots represent the distribution of support for the true affinity for each biome at each node/corner of the ancestral state reconstructions. Gray boxplots represent the distribution of null probabilities of sampling the true ancestral affinity by chance, as done by Braga et. al. (2020). Columns of each plot include support for biome affinity (established/enabled) non-affinity, persistent biome occupancy (established affinity), biome non-occupancy (enabled/non-affinity). Four simulation treatments of 100 datasets are shown for two treatments of tree size (Small Tree= 50 tips, Large Tree=500 tips) and exponential prior scaling parameter(Slow=0.5, Fast=2.0). A) Small tree and slow rate treatment, B) Small tree and fast rate treatment, C) Large tree and slow rate treatment, D) Large tree and fast rate treatment.
Figure 5:
Figure 5:
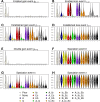
Posterior distributions of RFBS parameters for Viburnum. Rate parameters are g for affinity gain and l for affinity loss, which are subscripted by the transition type: 2=established affinity, 1=enabled affinity, an 0=non-affinity. Cladogenetic probability parameters are e for equal-affinity inheritance, s for subset-affinity inheritance, and b for between-affinity split inheritance. Colors indicate different treatments where different criteria informed unestablished biome affinities, including 1) a climatic adjacency rule (A) where species could not have a non-affinity (established or enabled) for warm temperate if there was an affinity for cold temperate and tropical; 2) included enabled affinities (I) from long term persistence in non-native biomes (via arboretums) under conservative (c) and bold (b) expert-based assessments; 3) excluded enabled affinities (E) based on evidence of non-affinity under conservative (c) and bold (b) expert-based assessments. Violin plots show parameter estimates, with circles indicating posterior medians, and lines indicating 25th and 75th percentile interquartile ranges. We show here the strongest exclusion criteria from our set of exclusion criteria (conservative/bold germination and bold leafing habit) which includes expert taxonomic interpolation to exclude the maximum possible set of enabled affinities.
Figure 6:
Figure 6:
Ancestral state reconstruction of Viburnum biome affinities from RFBS using conservative included and excluded enabled affinity tip data. Note, this is a two-page figure. Node and corner pie chart triplets represent the probability for each biome established/enabled affinity given the probabilities for each state. Outer colored circles represent posterior probability support for enabled affinities (red: tropical, green: warm temperate, blue: cold temperate) while black inner circles represent posterior probability for established biome affinities. Colored circles between affinity probability pie charts and tip labels denote information used to reduce tip ambiguity. Dark red “E”: enabled biome affinity excluded; dark yellow “I”: established biome affinity included; dark blue “A”: climatic adjacency rule applied (i.e., a species cannot have an affinity for cold temperate and tropical biomes with no affinity for intermediary warm temperate biomes).
Figure 6:
Figure 6:
Ancestral state reconstruction of Viburnum biome affinities from RFBS using conservative included and excluded enabled affinity tip data. Note, this is a two-page figure. Node and corner pie chart triplets represent the probability for each biome established/enabled affinity given the probabilities for each state. Outer colored circles represent posterior probability support for enabled affinities (red: tropical, green: warm temperate, blue: cold temperate) while black inner circles represent posterior probability for established biome affinities. Colored circles between affinity probability pie charts and tip labels denote information used to reduce tip ambiguity. Dark red “E”: enabled biome affinity excluded; dark yellow “I”: established biome affinity included; dark blue “A”: climatic adjacency rule applied (i.e., a species cannot have an affinity for cold temperate and tropical biomes with no affinity for intermediary warm temperate biomes).

Similar articles

References

    1. Anderson Eric C., Ng Thomas C., Crandall Eric D., and Garza John Carlos. Genetic and individual assignment of tetraploid green sturgeon with SNP assay data. Conservation Genetics, 18(5):1119–1130, October 2017. ISSN 1566–0621, 1572–9737. doi: 10.1007/s10592-017-0963-5. URL 10.1007/s10592-017-0963-5. - DOI - DOI
    1. Antonelli Alexandre, Zizka Alexander, Carvalho Fernanda Antunes, Scharn Ruud, Bacon Christine D., Silvestro Daniele, and Condamine Fabien L.. Amazonia is the primary source of Neotropical biodiversity. Proceedings of the National Academy of Sciences, 115(23):6034–6039, June 2018. ISSN 0027–8424, 1091–6490. doi: 10.1073/pnas.1713819115. URL 10.1073/pnas.1713819115. - DOI - DOI - PMC - PubMed
    1. Araújo Miguel B. and Luoto Miska. The importance of biotic interactions for modelling species distributions under climate change. Global Ecology and Biogeography, 16(6):743–753, 2007. ISSN 1466–8238. doi: 10.1111/j.1466-8238.2007.00359.x. URL https://onlinelibrary.wiley.com/doi/abs/10.1111/j.1466-8238.2007.00359.x. _eprint: https://onlinelibrary.wiley.com/doi/pdf/10.1111/j.1466-8238.2007.00359.x. - DOI - DOI - DOI
    1. Ashman L. G., Bragg J. G., Doughty P., Hutchinson M. N., Bank S., Matzke N. J., Oliver P., and Moritz C.. Diversification across biomes in a continental lizard radiation. Evolution, 72(8):1553–1569, August 2018. ISSN 0014–3820. doi: 10.1111/evo.13541. URL 10.1111/evo.13541. - DOI - DOI - PubMed
    1. Axelrod Daniel I.. Edaphic Aridity as a Factor in Angiosperm Evolution. The American Naturalist, 106(949):311–320, 1972. ISSN 0003–0147. URL https://www.jstor.org/stable/2459779. Publisher: [University of Chicago Press, American Society of Naturalists; ].

Publication types

LinkOut - more resources