iBet uBet web content aggregator. Adding the entire web to your favor.


Link to original content: http://pubmed.ncbi.nlm.nih.gov/39148510/
CrysFormer: Protein structure determination via Patterson maps, deep learning, and partial structure attention - PubMed Skip to main page content
U.S. flag

An official website of the United States government

Dot gov

The .gov means it’s official.
Federal government websites often end in .gov or .mil. Before sharing sensitive information, make sure you’re on a federal government site.

Https

The site is secure.
The https:// ensures that you are connecting to the official website and that any information you provide is encrypted and transmitted securely.

Access keys NCBI Homepage MyNCBI Homepage Main Content Main Navigation
. 2024 Aug 14;11(4):044701.
doi: 10.1063/4.0000252. eCollection 2024 Jul.

CrysFormer: Protein structure determination via Patterson maps, deep learning, and partial structure attention

Affiliations

CrysFormer: Protein structure determination via Patterson maps, deep learning, and partial structure attention

Tom Pan et al. Struct Dyn. .

Abstract

Determining the atomic-level structure of a protein has been a decades-long challenge. However, recent advances in transformers and related neural network architectures have enabled researchers to significantly improve solutions to this problem. These methods use large datasets of sequence information and corresponding known protein template structures, if available. Yet, such methods only focus on sequence information. Other available prior knowledge could also be utilized, such as constructs derived from x-ray crystallography experiments and the known structures of the most common conformations of amino acid residues, which we refer to as partial structures. To the best of our knowledge, we propose the first transformer-based model that directly utilizes experimental protein crystallographic data and partial structure information to calculate electron density maps of proteins. In particular, we use Patterson maps, which can be directly obtained from x-ray crystallography experimental data, thus bypassing the well-known crystallographic phase problem. We demonstrate that our method, CrysFormer, achieves precise predictions on two synthetic datasets of peptide fragments in crystalline forms, one with two residues per unit cell and the other with fifteen. These predictions can then be used to generate accurate atomic models using established crystallographic refinement programs.


Conflict of interest statement

The authors have no conflicts to disclose.

Figures

FIG. 1.
FIG. 1.
Abstract depiction of the Crysformer, which utilizes a one-way attention mechanism (red and purple arrows) to incorporate partial structure information. The tokens from the additional partial structures come from an initial 3D CNN embedding and are not passed to the next layer.
FIG. 2.
FIG. 2.
Example visualizations of electron density predictions for earlier baseline models and CrysFormer: Ground truth density maps are shown in blue, while predictions are shown in red. The model used to generate the ground truth electron density is shown in stick representation for reference. (a) and (d) The convolution U-net plus a retraining run, (b) and (e) the convolution U-net plus an additional channel with partial structures and retraining, (c) and (f) the CrysFormer attention model.
FIG. 3.
FIG. 3.
Dipeptide dataset analysis. Left: Average phase error of model predictions from the test set plotted vs diffraction resolution. Right: Fraction of test model predictions for which phase error is <60° at various ranges of resolution. The results show well-phased structures to the limit of resolution of the test samples for the attention-based CrysFormer method.
FIG. 4.
FIG. 4.
Example visualizations of two successful test predictions after the CrysFormer retraining was performed; (a) with Pearson correlation 0.90 and percentile rank 82% and (b) with correlation 0.83 and percentile rank 55%. Ground truth density maps shown in blue and predictions shown in green. The model used to generate the ground truth electron density map is again shown in stick representation in black for reference.
FIG. 5.
FIG. 5.
Analysis of the phase errors for the CrysFormer model on a dataset of 15-mer peptide models. Left: Average phase error of model predictions vs diffraction reflection resolution. Right: Fraction of model predictions on a 15-residue dataset for which phase error is <60° at various ranges of resolution. The data suggest that a large fraction of structures were well-phased to a resolution of 2.7 A or better, and a smaller fraction was well-phased to the resolution limit.
FIG. 6.
FIG. 6.
Analysis of R-free using an atomic model fitted to a fixed input map vs Pearson correlation coefficient between the ground truth map and the predicted map for a subset of the test cases. The scatterplot shows a large fraction of values in the lower right quadrant, demonstrating a strong correlation between the directly predicted map and the ability to interpret the map as accurate atomic coordinates.
FIG. 7.
FIG. 7.
The general success of the CrysFormer is demonstrated by successfully interpreting the predicted electron density maps of the test set to produce atomic structures. The movement of points downward relative to the raw results shown in Fig. 6 proves the structures have been solved in the crystallographic sense. Left: Scatterplot of post-refinement R-free values vs correlation between the predicted and ground truth maps, after full-scale AutoBuild refinement was applied. Right: Scatterplot of post-refinement R-free vs map correlation values, starting with the coordinates derived from only a CrysFormer-supplied fixed input map.
FIG. 8.
FIG. 8.
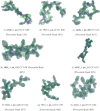
More test visualizations for the dipeptide dataset. (a) and (d) The convolution U-net plus a retraining run, (b) and (e) the convolution U-net plus an additional channel with partial structures and retraining, (c) and (f) the CrysFormer attention model.
FIG. 9.
FIG. 9.
More test prediction visualizations for the 15-residue dataset. See sublabels for Pearson correlation and percentile rank of examples.
FIG. 10.
FIG. 10.
Scatterplot of the Pearson correlations of ground truth vs model-based diffraction amplitudes for the poly-alanine chains auto traced by shelxe for all 16 230 test cases. The results show that most cases (upper right cloud) were “solved” correctly by the Crysformer as they could be reduced to coordinates whose calculated diffraction matches the ground truth diffraction pattern.

Similar articles

References

    1. Tanford C. and Reynolds J., Nature's Robots: A History of Proteins ( Oxford University Press, 2004).
    1. Drenth J., Principles of Protein X-Ray Crystallography ( Springer Science & Business Media, 2007).
    1. Brini E., Simmerling C., and Dill K., “ Protein storytelling through physics,” Science 370, eaaz3041 (2020).10.1126/science.aaz3041 - DOI - PMC - PubMed
    1. Sippl M. J., “ Calculation of conformational ensembles from potentials of mena force: An approach to the knowledge-based prediction of local structures in globular proteins,” J. Mol. Biol. 213, 859–883 (1990).10.1016/S0022-2836(05)80269-4 - DOI - PubMed
    1. Šali A. and Blundell T. L., “ Comparative protein modelling by satisfaction of spatial restraints,” J. Mol. Biol. 234, 779–815 (1993).10.1006/jmbi.1993.1626 - DOI - PubMed

LinkOut - more resources