iBet uBet web content aggregator. Adding the entire web to your favor.


Link to original content: http://pubmed.ncbi.nlm.nih.gov/39112488/
Multi-omic analysis of Huntington's disease reveals a compensatory astrocyte state - PubMed Skip to main page content
U.S. flag

An official website of the United States government

Dot gov

The .gov means it’s official.
Federal government websites often end in .gov or .mil. Before sharing sensitive information, make sure you’re on a federal government site.

Https

The site is secure.
The https:// ensures that you are connecting to the official website and that any information you provide is encrypted and transmitted securely.

Access keys NCBI Homepage MyNCBI Homepage Main Content Main Navigation
. 2024 Aug 8;15(1):6742.
doi: 10.1038/s41467-024-50626-0.

Multi-omic analysis of Huntington's disease reveals a compensatory astrocyte state

Affiliations

Multi-omic analysis of Huntington's disease reveals a compensatory astrocyte state

Fahad Paryani et al. Nat Commun. .

Abstract

The mechanisms underlying the selective regional vulnerability to neurodegeneration in Huntington's disease (HD) have not been fully defined. To explore the role of astrocytes in this phenomenon, we used single-nucleus and bulk RNAseq, lipidomics, HTT gene CAG repeat-length measurements, and multiplexed immunofluorescence on HD and control post-mortem brains. We identified genes that correlated with CAG repeat length, which were enriched in astrocyte genes, and lipidomic signatures that implicated poly-unsaturated fatty acids in sensitizing neurons to cell death. Because astrocytes play essential roles in lipid metabolism, we explored the heterogeneity of astrocytic states in both protoplasmic and fibrous-like (CD44+) astrocytes. Significantly, one protoplasmic astrocyte state showed high levels of metallothioneins and was correlated with the selective vulnerability of distinct striatal neuronal populations. When modeled in vitro, this state improved the viability of HD-patient-derived spiny projection neurons. Our findings uncover key roles of astrocytic states in protecting against neurodegeneration in HD.


Conflict of interest statement

The authors declare no competing interests.

Figures
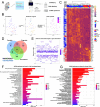
Fig. 1
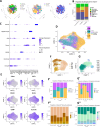
Fig. 1. Transcriptomic analysis of HD identifies cross-regional and CAG-correlated gene signatures.
A Schematic depicting experimental plan. B t-distributed stochastic neighbor (t-SNE) embedding of bulk RNAseq samples used in the study color-coded by condition (left), anatomic region (middle), and CAG repeat length (right). Control samples and ones with no available CAG repeat lengths are shown in grey. C Heatmap of normalized gene expression showing a select subset of differentially expressed genes (DEGs). The DEGs (rows) are color-coded on the right by the direction of differential expression in the specified region (left columns). DEGs Increased in Control: red, DEGs increased in HD: blue, non-significant (NS) genes – grey. The samples (Columns) are also color-coded by HD grade/Condition (Con: Control, HD1–4: 1–4, J: Juvenile onset HD) and anatomic region (top horizontal bars). D Venn diagram showing the overlap between DEGs with FDR-adjusted p value < 0.05 across the three anatomic regions. The numbers of increased – black, and decreased – blue, genes are indicated. E Scatter plot showing genes with significant regression weights for CAG repeat length (y-axis). The order of genes on the x-axis is arbitrary. Color indicates Benjamini–Hochberg adjusted p value. Genes with coefficients two standard deviations above the mean are indicated. FG EnrichR barplots of KEGG pathways enriched in genes that positively or negatively correlate with CAG repeat length (F) or in DEGs that are shared across two or three anatomic regions (increased and decreased—G). Gene count is indicated on the y-axis. Color indicates Benjamini–Hochberg adjusted p value. A was created with BioRender.com released under a Creative Commons Attribution-NonCommercial-NoDerivs 4.0 International license.
Fig. 2
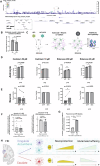
Fig. 2. Lipidomic analysis of HD cingulate cortex.
A Violin plot of the −log10 of the ANOVA p values (y-axis) of lipid species (x-axis) that correlate with HD grade – see related Fig. S3A for direct comparisons between HD and controls, and Supplementary Dataset-4 for abbreviations. B Scatter plot showing the projection of brain samples analyzed by lipidomics in the first two latent variables of the sparse-partial least squares (sPLS) discriminant analysis model. The variance explained by each latent variable is indicated on the axes. The samples are color- and shape-coded by condition/grade. The condition can be predicted to a high degree of accuracy in the colored background regions - see related Fig. S3B. C Integration of lipidomics data and matched bulk RNAseq data generated from adjacent samples of the same brain region using sparse projection to latent space analysis. The samples are color- and shape-coded as per B and projected in the combined integrated space. D Barplots showing the loadings of the lipid species (left) and RNA transcripts (right) in the first sparse projection to latent space variable that predicts grade. E Gene ontology enrichment analysis of component 1 genes (from D). Negative log10 of the adjusted p values are indicated. P value adjustment was done in gprofiler using the g:SCS method. F Quantification of the percentage of viable murine neurons treated for 24 h with the indicated concentrations of di-homo gamma lenolenic acid (DGLA), a poly-unsaturated fatty acid increased in HD. Illustration of the structure of DGLA is indicated on the top. N = 3 experiments. Unpaired two-tailed test. P values = 0.936 for 20 µg/ml vs vehicle, p = 0.746 for 100 µg/ml vs vehicle and p = 0.091 for 200 µg/ml vs vehicle. Data are shown as mean ±  SEM. G Quantification of the viability of murine neurons co-treated with 20 µM Rotenone and the indicated concentrations of DGLA (black dots) or Ethanol (grey dots). N = 4 experiments. Paired two-tailed t-test. P = 0.056 for 20 µg/ml, p = 0.002 for 100 µg/ml and p = 0.024 for 200 µg/ml.
Fig. 3
Fig. 3. snRNAseq data analysis of HD and control astrocytes.
A t-SNE projection of snRNAseq samples across all lineages (left), brain regions (middle), and condition (right). B Stacked bar plots depicting the proportion (y-axis) of each cell lineage (color-coded) in different brain regions (x-axis). C Dot plot showing expression of select cell type/lineage marker genes. D UMAP plot of astrocytes projected in isolation of other cell types, and color-coded by region. The bar plot on the top right shows the distribution of astrocyte between the three brain regions. E Feature plots of normalized gene expression projected in the UMAP embeddings to highlight genes that differentiate fibrous-like (left) and protoplasmic astrocytes (right) – see also Fig. S5C. F UMAPs of sub-clusters of fibrous-like astrocytes (defined by highest expression of CD44 - cluster 0 see Fig. S5C). The barplots below show the proportion of different brain regions in each sub-cluster (F′) and the proportion of the sub-clusters in each HD grade/Condition (F″). G UMAPs of protoplasmic astrocytic sub-clusters (defined as all astrocytes except cluster 0 in Fig. S5C). The barplots below show the proportion of different brain regions in each sub-cluster (G′) and the proportion of the sub-clusters in each HD grade/Condition (G″).
Fig. 4
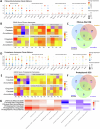
Fig. 4. Astrocytes are regionally heterogeneous in HD.
A Dot plot displaying the expression of select genes in fibrous-like astrocytic clusters. The genes were selected from four gene sets (Quiescent: baseline astrocyte genes, Neuroprotective: predicted from our previous work – see main text, CAG-Correlated: genes with significant positive regression weights - see Fig. 1E for more details, RNA-Correlated Lipid.: set of genes that correlated with lipid abundance from Fig. S3D. B Heatmap of the average enrichment scores determined by gene set variation analysis of select gene sets within each fibrous-like astrocytic sub-cluster per brain region. The gene sets of interest include the four in A, a core astrocytic signature described in Diaz-Castro et al. , and a GO term for response to unfolded protein (GO:0006986). C Venn diagram showing overlap between the differentially expressed genes (DEGs) in HD vs control in all fibrous-astrocytes across the three brain regions (increased: blue; decreased: black). D Similar to (A) but for protoplasmic astrocytic sub-clusters. E Similar to (B) but for protoplasmic astrocytic sub-clusters. F Similar to (C) but for protoplasmic astrocytes. G Heatmap displaying the negative log10(p-value) of enrichment of select GO terms (columns) in DEGs from fibrous-like and protoplasmic astrocytes DEGs per region (C, F) – rows. Red indicates terms significantly enriched in DEGs increased in HD, blue indicates GO terms enriched in DEGs significantly decreased in HD, and white indicates no significance. P value adjustment was done in gprofiler using the g:SCS method.
Fig. 5
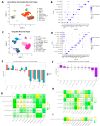
Fig. 5. Single nucleus RNAseq analysis and differential abundance analysis of neurons in HD show correlations to astrocytic states.
A UMAP plot of nucleus accumbens and caudate neuronal subtypes. B Dot plot of select gene markers for the striatal neuronal subtypes in (A). C UMAP plot of cingulate neuronal subtypes. D Dot plot of select gene markers for cingulate neuronal subtypes in (C). E Differential abundance analysis comparing the enrichment or depletion of striatal neuronal subtypes in (A) in HD (caudate n = 16, accumbens n = 12) versus control (caudate n = 5, accumbens n = 4). The logFC values from ANCOM-BC linear regression model are shown on the y-axis for each cell type. Stars indicate statistically significant differences (Holm-adjusted p-values < 0.05). Holm-adjusted p-values indicated by stars from left to right are 7.72e−5, 9,76e−3, 3.30e−6, 3.58e−11, 1.99e−16, 3.28e−5, 4.85e−8, 1.33e−6, 2.78e−10. Error bars indicate standard errors. F Similar to E but for cingulate neurons from (C) in HD (n = 19) versus control (n = 9) with Holm-adjusted p-value 1.19e−3. G Heatmap displaying the correlation proportion of fibrous-like and protoplasmic sub-clusters (Fig. 3F, G) – columns, with proportions of select accumbens neuronal sub-clusters – rows. The values in the tile represent the Pearson correlation coefficient and p-values in parentheses. Two-tailed Pearson correlation p values were determined using cor.test(). H Similar to (G) but for select caudate neurons. I Similar to (G) but for a select cingulate neuronal cluster (L5/6 glutamatergic SEMA3E+TSHZ2+) depleted in HD.
Fig. 6
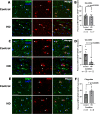
Fig. 6. MT3 expression is increased in the cingulate and decreased in the Caudate of HD brains.
A Immunofluorescent images of the caudate sections labeled for nuclei (DAPI-blue) and GFAP (green) to detect astrocytes (left), and MT (red-middle panel). A merged panel is shown on the right. Arrows indicate DAPI, GFAP and MT positive cells (MT-positive astrocytes) and arrowheads indicate MT negative astrocytes. The antibody detects MT2A and MT1 proteins. Scale bar = 50 μm. B Quantification of the percent of MT-positive astrocytes in the caudate. Unpaired one-tailed t-test with n = 6 for control and 7 for HD. Data are shown as mean ± SEM. P value = 0.3232. C Immunofluorescent images of the caudate labeled for nuclei (DAPI-blue) and GFAP (green) to detect astrocytes (left panel), and MT3 (red-middle panel). A merge of the three channels is shown on the right. Arrows indicate DAPI, GFAP and MT3 positive cells (MT3 positive astrocytes) and arrowheads indicate MT3 negative astrocytes. Scale bar = 50 μm. D Quantification of the percent of astrocytes that were MT3 positive in the caudate. Unpaired one-tailed t-test used with  n = 10 for control and 11 for HD. Data are shown as mean ± SEM. P value = <0.0001. E Same as D but for the cingulate. F Quantification of the percent of percent of astrocytes that were MT3 positive in the cingulate. Unpaired one-tailed t-test with n = 8 for control and 6 for HD. Data are shown as mean ± SEM. P value = 0.0405. For all IHC panels, control and HD images are shown on the top and bottom rows, respectively.
Fig. 7
Fig. 7. Metallothioneins are implicated in GWA studies and promote neuronal viability.
A Genome-wide Association study (GWAS) of residual age of motor onset in HD. This study combines data from the Venezuelan Kindreds and GeM-HD consortium of patients. A LocusZoom plot of the metallothionein (MT) gene cluster (box) on chromosome 16 is shown, depicting the SNPs in the association analysis on chr16 and the log-transformed associated Wald’s p-value (y-axis) measured using a mixed linear model. SNPs are color-coded by the r2 of linkage disequilibrium (LD) with the representative SNP rs74611520 (diamond). Two neighboring SNPs (rs2518054, rs3812963) in high linkage disequilibrium are indicated by red triangles and outlined by dotted ellipse. B Glutamate levels in media conditioned by MT3 astrocytes normalized by levels in control human astrocytes (HA). Paired one-tailed t-test with N = 3 experiments. p = 0.0011. C A cartoon depiction of the design of the astrocyte-neuron co-culture viability experiment. Neurons (GFP−) and astrocytes (GFP+) were separated using flow cytometry-activated sorting (FACS). Cd: Cadmium. D Bar plots of the viability of FACS sorted MT3 overexpressing astrocytes normalized by viability of control GFP astrocytes under the indicated conditions. n = 3–4 independent biological replicates as indicated. Paired one-tailed t-tests. E Bar plots of FACS sorted murine neuronal viability when co-cultured with MT3 overexpressing astrocytes normalized by neuronal viability of sorted neurons co-cultured with control GFP+ astrocytes. Treatment conditions as per D. n = 3–4 independent biological replicates as indicated. Paired one-tailed t-tests. P values are indicated. F Expression of Annexin V and Caspase 3/7 in HD-derived directly reprogrammed SPNs co-cultured with control (GFP) versus MT3 astrocytes at 30 and 32 days in co-culture. The values are expressed as fold change from control. N = 3 biological replicates. The p values are indicated. One-tailed one-sample t-test. G Example of Annexin V signal in control versus HD derived directly reprogrammed SPNs co-cultured with control astrocytes at day 30 demonstrating significant neurodegeneration in HD co-cultures evidenced by the increase in Annexin V signal. N = 4 and 6 technical replicates for control and HD, respectively, two-tailed unpaired t-test, the p values are indicated. For B, DG, the data are shown as mean ± SEM. H Summary of our understanding of astrocytic states and regional heterogeneity in HD as it relates to neuroprotection. Panels C and H were created with BioRender.com released under a Creative Commons Attribution-NonCommercial-NoDerivs 4.0 International license.

Update of

Similar articles

References

    1. Hirano, M. et al. Clinicopathological differences between the motor onset and psychiatric onset of Huntington’s disease, focusing on the nucleus accumbens. Neuropathology39, 331–341 (2019). 10.1111/neup.12578 - DOI - PubMed
    1. Hebb, M. O., Denovan-Wright, E. M. & Robertson, H. A. Expression of the Huntington’s disease gene is regulated in astrocytes in the arcuate nucleus of the hypothalamus of postpartum rats. FASEB J.13, 1099–1106 (1999). 10.1096/fasebj.13.9.1099 - DOI - PubMed
    1. DiFiglia, M. et al. Aggregation of huntingtin in neuronal intranuclear inclusions and dystrophic neurites in brain. Science277, 1990–1993 (1997). 10.1126/science.277.5334.1990 - DOI - PubMed
    1. Mangiarini, L. et al. Exon 1 of the HD gene with an expanded CAG repeat is sufficient to cause a progressive neurological phenotype in transgenic mice. Cell87, 493–506 (1996). 10.1016/S0092-8674(00)81369-0 - DOI - PubMed
    1. Roos, R. A., Pruyt, J. F., de Vries, J. & Bots, G. T. Neuronal distribution in the putamen in Huntington’s disease. J. Neurol. Neurosurg. Psychiatry48, 422–425 (1985). 10.1136/jnnp.48.5.422 - DOI - PMC - PubMed