iBet uBet web content aggregator. Adding the entire web to your favor.


Link to original content: http://pubmed.ncbi.nlm.nih.gov/39090739/
Artificial intelligence in fusion protein three-dimensional structure prediction: Review and perspective - PubMed Skip to main page content
U.S. flag

An official website of the United States government

Dot gov

The .gov means it’s official.
Federal government websites often end in .gov or .mil. Before sharing sensitive information, make sure you’re on a federal government site.

Https

The site is secure.
The https:// ensures that you are connecting to the official website and that any information you provide is encrypted and transmitted securely.

Access keys NCBI Homepage MyNCBI Homepage Main Content Main Navigation
Review
. 2024 Aug;14(8):e1789.
doi: 10.1002/ctm2.1789.

Artificial intelligence in fusion protein three-dimensional structure prediction: Review and perspective

Affiliations
Review

Artificial intelligence in fusion protein three-dimensional structure prediction: Review and perspective

Himansu Kumar et al. Clin Transl Med. 2024 Aug.

Abstract

Recent advancements in artificial intelligence (AI) have accelerated the prediction of unknown protein structures. However, accurately predicting the three-dimensional (3D) structures of fusion proteins remains a difficult task because the current AI-based protein structure predictions are focused on the WT proteins rather than on the newly fused proteins in nature. Following the central dogma of biology, fusion proteins are translated from fusion transcripts, which are made by transcribing the fusion genes between two different loci through the chromosomal rearrangements in cancer. Accurately predicting the 3D structures of fusion proteins is important for understanding the functional roles and mechanisms of action of new chimeric proteins. However, predicting their 3D structure using a template-based model is challenging because known template structures are often unavailable in databases. Deep learning (DL) models that utilize multi-level protein information have revolutionized the prediction of protein 3D structures. In this review paper, we highlighted the latest advancements and ongoing challenges in predicting the 3D structure of fusion proteins using DL models. We aim to explore both the advantages and challenges of employing AlphaFold2, RoseTTAFold, tr-Rosetta and D-I-TASSER for modelling the 3D structures. HIGHLIGHTS: This review provides the overall pipeline and landscape of the prediction of the 3D structure of fusion protein. This review provides the factors that should be considered in predicting the 3D structures of fusion proteins using AI approaches in each step. This review highlights the latest advancements and ongoing challenges in predicting the 3D structure of fusion proteins using deep learning models. This review explores the advantages and challenges of employing AlphaFold2, RoseTTAFold, tr-Rosetta, and D-I-TASSER to model 3D structures.

Keywords: AI; AlphaFold2; RoseTTAFold; deep learning; fusion protein structure; protein structure prediction.


Conflict of interest statement

The authors declare no conflicts of interest.

Figures
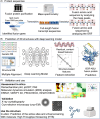
FIGURE 1
FIGURE 1
Overview of deep learning model to predict the fusion protein structure prediction. (A) Protein sequences. (B) Prediction of three‐dimensional (3D) structures with deep learning model. (C) Assessment in silico, Validation and use of the predicted 3D structure.
FIGURE 2
FIGURE 2
Traditional protein structure prediction modelling: (A) Template‐based, (B) integrative, (C) Hybrid.
FIGURE 3
FIGURE 3
Deep learning–based protein structure prediction model.
FIGURE 4
FIGURE 4
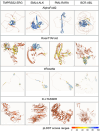
Three‐dimensional (3D) protein structure prediction and PLDDT‐based visualization of predicted structure: AlphaFold2, RoseTTAFold, trRosetta and D‐I‐TASSER with examples. TMPRSS2‐ERG, EML4‐ALK, PML‐RARA and BCR‐ABL fusion protein with corresponding PLDDT plots. Colour ranges from red to blue: red indicates lower accuracy (0–50), yellow indicates medium accuracy (51–70) and blue indicates higher accuracy (71–100).
FIGURE 5
FIGURE 5
Comparison of known structures and our predicted fusion proteins in the protein sequence alignment and three‐dimensional (3D) structure superimpose. Left Panels: Alignment of the BCR‐ABL (top) and PML‐RARA (bottom) fusion proteins with their related Protein Data Bank (PDB) entries. The BCR‐ABL fusion protein (blue and orange) is aligned against PDB entries 3QRI, 3QRK, 3QRJ, 6HD4, 6HD6, 5MO4, 4WA9 and 4TWP, whereas the PML‐RARA fusion protein (blue and orange) is aligned against PDB entries 8J25 and 8J2P. The red dashed line indicates the fusion point in each protein. Right Panels: Superimposed structures of the fusion proteins with their largest corresponding PDB entries.
FIGURE 6
FIGURE 6
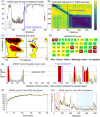
In silico assessment and validation of EML4‐ALK fusion protein. (A) PLDDT plot of top five models by AlpahFold2, (B) predicted alignment error plot (PAE), (C) Ramachandran plot, (D) WHATCHECK (each number corresponds to a specific check or validation parameter such as bond angles, bond lengths, planarity and torsion angles.), (E) ERRAT plot, (F) molecular dynamics simulation of fusion protein till 50 ns through Desmond. The left panel shows the root mean square deviation (RMSD) plot of C‐alpha, backbone, side chain and heavy atoms and (G) the right panel shows the root mean square fluctuation (RMSF) plot of C‐alpha, backbone, side chain, heavy atoms and B factor. Colour shading: red indicates alpha helices, and blue indicates beta helices.
FIGURE 7
FIGURE 7
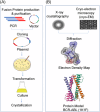
Schematic representation of experimental production, purification and validation of fusion protein structure. (A) Fusion protein production and purification (B) X‐ray crystallography and cryo‐electron microscopy for structure prediction.
FIGURE 8
FIGURE 8
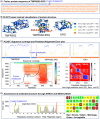
An example of sequence‐based fusion protein structure prediction, accuracy and validation of TMPRSS2‐ERG. (A) Sequence of fusion protein TMPRSS2‐ERG, (B) three‐dimensional (3D) structures by AlphaFold2, (C) confidence, coverage and PAE of the prediction model and (D) prediction of model assessment, ERRAT: The ERRAT plot shows the quality of the protein model by evaluating the non‐bonded atomic interactions. The Y‐axis represents the error values, and the X‐axis represents the residue position. Yellow bars: Residues with error values between 95% and 99%, indicating moderately reliable regions. Red bars: Residues with error values above 99%, indicating potentially unreliable regions. Grey bars: Residues with error values below 95%, indicating highly reliable regions. WHATCHECK: The WHATCHECK plot evaluates the quality of the protein structure by analyzing various geometrical parameters. Each square represents a different residue or region within the protein. Green squares: Regions with no errors, indicating a well‐modelled structure. Yellow squares: Regions with minor errors, suggesting potential areas for improvement. Red squares: Regions with significant errors, indicating potentially unreliable regions in the structure. The numerical values correspond to various geometric parameters, with colour coding reflecting the reliability of each region based on the WHATCHECK analysis.

Similar articles

Cited by

References

    1. Siegel JB, Zanghellini A, Lovick HM, et al. Computational design of an enzyme catalyst for a stereoselective bimolecular Diels–Alder reaction. Science. 2010;329:309‐313. - PMC - PubMed
    1. Kuhlman B, Dantas G, Ireton GC, Varani G, Stoddard BL, Baker D. Design of a novel globular protein fold with atomic‐level accuracy. Science. 2003;302:1364‐1368. - PubMed
    1. Webb B, Sali A. Comparative protein structure modeling using MODELLER. Curr Protoc Bioinf. 2016;54:5.6. 1‐5.6. 37. - PMC - PubMed
    1. Chen X, Zaro JL, Shen W‐C. Fusion protein linkers: property, design and functionality. Adv Drug Delivery Rev. 2013;65:1357‐1369. - PMC - PubMed
    1. Hall A, Burke N, Dongworth R, Hausenloy D. Mitochondrial fusion and fission proteins: novel therapeutic targets for combating cardiovascular disease. Br J Pharmacol. 2014;171:1890‐1906. - PMC - PubMed

LinkOut - more resources