iBet uBet web content aggregator. Adding the entire web to your favor.


Link to original content: http://pubmed.ncbi.nlm.nih.gov/39048794/
A sequence of SVA retrotransposon insertions in ASIP shaped human pigmentation - PubMed Skip to main page content
U.S. flag

An official website of the United States government

Dot gov

The .gov means it’s official.
Federal government websites often end in .gov or .mil. Before sharing sensitive information, make sure you’re on a federal government site.

Https

The site is secure.
The https:// ensures that you are connecting to the official website and that any information you provide is encrypted and transmitted securely.

Access keys NCBI Homepage MyNCBI Homepage Main Content Main Navigation
. 2024 Aug;56(8):1583-1591.
doi: 10.1038/s41588-024-01841-4. Epub 2024 Jul 24.

A sequence of SVA retrotransposon insertions in ASIP shaped human pigmentation

Affiliations

A sequence of SVA retrotransposon insertions in ASIP shaped human pigmentation

Nolan Kamitaki et al. Nat Genet. 2024 Aug.

Abstract

Retrotransposons comprise about 45% of the human genome1, but their contributions to human trait variation and evolution are only beginning to be explored2,3. Here, we find that a sequence of SVA retrotransposon insertions in an early intron of the ASIP (agouti signaling protein) gene has probably shaped human pigmentation several times. In the UK Biobank (n = 169,641), a recent 3.3-kb SVA insertion polymorphism associated strongly with lighter skin pigmentation (0.22 [0.21-0.23] s.d.; P = 2.8 × 10-351) and increased skin cancer risk (odds ratio = 1.23 [1.18-1.27]; P = 1.3 × 10⁻²⁸), appearing to underlie one of the strongest common genetic influences on these phenotypes within European populations4-6. ASIP expression in skin displayed the same association pattern, with the SVA insertion allele exhibiting 2.2-fold (1.9-2.6) increased expression. This effect had an unusual apparent mechanism: an earlier, nonpolymorphic, human-specific SVA retrotransposon 3.9 kb upstream appeared to have caused ASIP hypofunction by nonproductive splicing, which the new (polymorphic) SVA insertion largely eliminated. Extended haplotype homozygosity indicated that the insertion allele has risen to allele frequencies up to 11% in European populations over the past several thousand years. These results indicate that a sequence of retrotransposon insertions contributed to a species-wide increase, then a local decrease, of human pigmentation.


Conflict of interest statement

The authors declare no competing interests.

Figures

Fig. 1
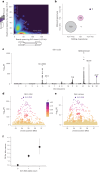
Fig. 1. Characterization of a polymorphic SVA F1 retrotransposon insertion within an intron of ASIP.
a, Architecture of ASIP isoforms and composition of the SVA F1 retrotransposon insertion. ASIP has four known alternate first exons (dark blue), with the first three (exons 1A, 1B and 1C) able to either splice directly to a coding exon (gold; exon 3) or first to an additional 5′ UTR exon (light blue; exon 2). The SVA F1 insertion contains the expected 5′ truncation with MAST2 exon followed by VNTR and SINE-R sequences. The location of the SVA F1 insertion, present in the GRCh38 reference, is indicated by the purple thin vertical bar. b, Pairwise sequence alignment dotplot of long-read sequencing-derived haplotypes from an individual heterozygous for the SVA F1 insertion (NA12329). The SVA F1 insertion, present in the haplotype on the y axis, corresponds to the vertical break in the diagonal alignment (purple) and bears substantial homology (dashes to the left of the vertical break) to a nonpolymorphic SVA F retrotransposon 3.9 kb upstream (light purple). c, Genotyping approach for short-read data. Read alignments overlapping the right breakpoint of the SVA F1 indicate the presence of at least one insertion allele, whereas discordant read pairs with excessively long fragment sizes indicate the presence of at least one non-insertion allele (Methods). CDS, coding sequence. d, Determination of SVA insertion genotypes for individuals in the 1KGP. Individuals homozygous for the ancestral allele without the SVA F1 insertion (Hom-ANC; gray) are the most common and have no or few reads overlapping the right breakpoint; individuals homozygous for the insertion allele (Hom-INS; purple) are the least frequent and have few or no reads with fragment size >2.5 kb; heterozygous individuals have both read types (Het; pink). e, SVA F1 insertion allele frequency across 1KGP populations. The insertion is present in European genetic ancestry populations and others with known European admixture but is otherwise absent. f, Extensive LD (r2) of the SVA F1 insertion (at 34.2 Mb) with variants in a 5-Mb window on chromosome (chr) 20 (32.5–37.5 Mb; GRCh38 coordinates) in CEU and GBR 1KGP populations.
Fig. 2
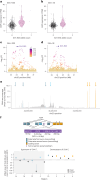
Fig. 2. Association of SVA F1 insertion with pigmentation phenotypes in UKB.
a, Genotyping of 199,956 UKB participants with WGS. Three genotype clusters corresponding to the dosage of the SVA F1 insertion are apparent. b, Genotype concordance of 917 sibling pairs sharing both ASIP haplotypes IBD2. All but one of the sibling pairs agree on the genotype call made for the SVA F1 insertion. c, Associations of genome-wide imputed SNP and indel variants with self-reported skin color, coded on a scale from fairest to darkest (n = 167,568); P values are from linear regression. The association of the SVA F1 insertion is plotted in purple. d, Local association plot for skin color (n = 167,568) at the extended ASIP locus. Association strengths track with LD with the SVA F1 insertion (yellow-to-purple shading), indicated by the large purple dot. e, Associations at ASIP with any type of skin cancer (C43 or C44 ICD-10 code; ncontrols = 154,340 and ncases = 15,295). f, ORs for skin cancer risk for individuals heterozygous (n = 31,932) or homozygous (n = 1,952) for the SVA F1 insertion relative to individuals homozygous for no insertion (n = 135,751). Centers, effect size estimate for each genotype from logistic regression; error bars, 95% CIs.
Fig. 3
Fig. 3. Association of SVA F1 insertion with expression of ASIP exons and introns in skin.
a, ASIP gene expression in GTEx NSE skin samples (n = 517) stratified by SVA F1 insertion genotype. b, Analogous to a, for GTEx SE skin samples (n = 605). c, Local association plot for ASIP gene expression in NSE skin samples (n = 517). Association strengths track with LD with the SVA F1 insertion (yellow-to-purple shading). d, Analogous to c, for GTEx SE skin samples (n = 605). e, Depth of coverage of RNA-seq read alignments at ASIP, averaged across NSE skin samples. Coverage at exons is indicated with colors corresponding to the ASIP gene model below (dark blue, alternative first 5′ UTR exons; light blue, optional second 5′ UTR exon; gold, coding exons). RNA-seq coverage in introns is indicated in gray. f, Effect size of SVA F1 insertion for expression of each ASIP exon and intron (in units of allelic fold change; aFC) in NSE skin samples (n = 517). Intronic regions are defined between adjacent exons; measurements in these regions presumably correspond to prespliced mRNA, potentially from several isoforms. Centers, point estimate of aFC from linear regression coefficients for the indicated region; error bars, 95% CIs from bias-corrected and accelerated bootstrap.
Fig. 4
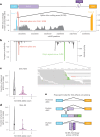
Fig. 4. Aberrant splicing and early polyadenylation of ASIP transcripts from haplotypes without SVA F1 insertion.
a, RNA-seq coverage depth at ASIP (averaged across NSE skin samples), annotated with splice junctions from the exon 2 (5′ UTR) splice donor. Most split reads support the canonical splice junction to exon 3 (n = 4,018 reads; black junction), but a substantial minority support an aberrant splice junction into an acceptor site in a nearby (nonpolymorphic) SVA F element (n = 619 reads; red junction). b, Computationally predicted splice acceptors (SpliceAI) and polyadenylation signals (APARENT). Inset, RNA-seq read alignments containing soft-clipped poly(A) sequences at the predicted polyadenylation peak. c, Fraction of splice junctions from exon 2 that aberrantly splice into the acceptor site in the nearby SVA F element (versus splicing to exon 3), stratified by SVA F1 insertion genotype in GTEx NSE skin samples. Only samples with greater than ten total reads supporting either splice junction are included in the violin plots (n = 131) to reduce noise from less informative samples. Centers, combined fraction of aberrant splicing across all samples with each SVA F1 insertion genotype (total n = 517); error bars, 95% CIs from bias-corrected and accelerated bootstrap. d, Analogous to c, for GTEx SE skin samples (n = 158 for violin plots). Centers, combined fraction of aberrant splicing across all samples with each SVA F1 insertion genotype (total n = 605); error bars, 95% CIs from bias-corrected and accelerated bootstrap. e, Proposed model for the effects of the ancient SVA F insertion and the recent SVA F1 insertion on splicing patterns of ASIP transcripts. The original hominid ancestral allele—lacking either retrotransposon—splices normally between alternate noncoding exon 2 and coding exon 3. Insertion of the SVA F element then causes a fraction of ASIP transcripts to splice aberrantly to the introduced acceptor site, leading to early polyadenylation. The subsequent SVA F1 insertion then restores normal splicing to coding exon 3 in all transcripts, possibly by sequestering the splice acceptor or splice enhancer motifs.
Fig. 5
Fig. 5. Recent selection for the SVA F1 insertion haplotype in ancestral European populations.
a, Extended haplotype homozygosity (EHH) plot for haplotypes with and without the SVA F1 insertion in UKB (n = 169,641). The EHH value at a given variant is the probability that two haplotypes are homozygous at all variants between it and the focal variant (here, the SVA F1 insertion). Haplotypes with the SVA F1 insertion have higher EHH in both directions, suggesting recent positive selection on the allele. b, Haplotype bifurcation diagram depicting haplotypes with and without the SVA F1 insertion (1,000 haplotypes per group, selected randomly from the UKB analysis set). Bifurcations indicate SNPs that distinguish haplotypes, and line weights indicate proportions of haplotypes that carry each SNP allele. This diagram provides a haplotype-level representation of the comparatively reduced number of recombination events that have occurred on haplotypes containing the SVA F1 insertion. c, LD in 5-Mb region surrounding ASIP (32.5–37.5 Mb; GRCh38 coordinates) in 1KGP superpopulations (excluding admixed African populations). For each superpopulation, 13,000 SNP/indel variants with MAF > 1% were sampled, and the LD plot displays a red point for each pair of variants with r2 > 0.2. Haplotypes sampled in populations with European genetic ancestry (n = 1,006) exhibit excess LD between variants in this region compared with African (n = 1,002) or East Asian (n = 1,008) haplotypes. The purple point indicates the relative position of the SVA F1 insertion in European haplotypes. d, Evolution of hair and skin pigmentation in hominid lineages, with relative timing and pigmentation effects of each SVA insertion highlighted. Ancestral hominids and many extant great apes have light skin pigmentation, with UV protection conferred by denser body hair. Early human evolution involved increasing pigmentation and decreasing body hair. The ancient SVA F retrotransposon, which is shared by Neanderthals with modern humans on all continents, may have inserted during this period into the ASIP intron—decreasing ASIP expression and increasing pigmentation—and became fixed in Homo sapiens. Much more recently, a subsequent SVA F1 insertion appeared and expanded in frequency (to several percent) within ancestral European populations, increasing ASIP expression and decreasing pigmentation.
Extended Data Fig. 1
Extended Data Fig. 1. Associations of SVA F1 insertion and nearby variants to pigmentation phenotypes in UK Biobank.
a-d, Local association plots in a 5-Mb window surrounding ASIP for (a) self-reported tanning ability (n = 166,404), (b) self-reported hair color (n = 167,310), (c) melanoma (C43 ICD-10 code, n = 169,635), and (d) other skin cancers including basal and squamous cell carcinomas (C44 ICD-10 code, n = 169,635). Association strengths track with linkage disequilibrium with the SVA F1 insertion (yellow-to-purple shading), indicated by the large purple dot. e-j, Conditional association plots for SNPs and indels after including SVA F1 genotype as a covariate for (e) self-reported skin color (n = 167,568), (f) any skin cancer (C43 or C44 ICD-10 codes, n = 169,635), (g) self-reported tanning ability (n = 166,404), (h) self-reported hair color (n = 167,310), (i) melanoma (C43 ICD-10 code, n = 169,635), and (j) other skin cancers including basal and squamous cell carcinomas (C44 ICD-10 code, n = 169,635).
Extended Data Fig. 2
Extended Data Fig. 2. Genome-wide associations with tanning ability and skin cancer risk in UK Biobank.
a, Associations from linear regression across all imputed variants with self-reported tanning ability (n = 166,404). b, Associations from linear regression across all imputed variants with any type of skin cancer (union of C43 and C44 ICD-10 codes, n = 169,635).
Extended Data Fig. 3
Extended Data Fig. 3. Genotyping of SVA F1 insertion in GTEx cohort.
a, Genotyping of 838 GTEx donors with whole-genome sequencing. b, Linkage disequilibrium (r2) of the SVA F1 insertion with variants between 32.5 Mb to 37.5 Mb on chromosome 20 across GTEx donors.
Extended Data Fig. 4
Extended Data Fig. 4. Associations of SVA F1 insertion and nearby variants to expression of ASIP in skin and tibial nerve.
a, ASIP gene expression in GTEx tibial nerve samples (n = 532), stratified by SVA F1 insertion genotype. Tibial nerve was the only other tissue that appeared to have evidence of the same eQTL. TPM, transcripts per million. b, Local association plot for ASIP gene expression in tibial nerve samples (n = 532) in the region 32.5 Mb to 37.5 Mb on chromosome 20. Association strengths track with linkage disequilibrium with the SVA F1 insertion (yellow-to-purple shading), indicated by the large purple dot. c, Conditional association plot for ASIP gene expression in GTEx skin (not sun-exposed, NSE) samples (n = 517) after including SVA F1 genotype as a covariate. d, As in c, but for skin (sun-exposed, SE) samples (n = 605). e, As in c, but for tibial nerve samples (n = 532).
Extended Data Fig. 5
Extended Data Fig. 5. Associations of SVA F1 insertion and nearby variants to aberrant ASIP splice junction usage in skin and tibial nerve.
a, Fraction of splice junctions from exon 2 that aberrantly splice into the acceptor site in the nearby SVA F element (versus splicing to exon 3), stratified by SVA F1 insertion genotype in GTEx tibial nerve samples. Only samples with greater than 10 total reads supporting either splice junction are included in the violin plot (n = 33) to reduce noise from less informative points. Centers: combined fraction of aberrant splicing across all samples with each SVA F1 insertion genotype (total n = 532); error bars: 95% CIs from bias-corrected and accelerated bootstrap. b, Local association plot for aberrant splice junction usage in skin (not sun-exposed, NSE) samples (n = 433) in the region 32.5 Mb to 37.5 Mb on chromosome 20. Association strengths track with linkage disequilibrium with the SVA F1 insertion (yellow-to-purple shading), indicated by the large purple dot. c, As in b, but after including SVA F1 genotype as a covariate. d, As in b, but for skin (sun-exposed, SE) samples (n = 497). e, As in d, but after including SVA F1 genotype as a covariate. f, As in b, but for tibial nerve samples (n = 364). g, As in f, but after including SVA F1 genotype as a covariate.
Extended Data Fig. 6
Extended Data Fig. 6. Characterization of non-polymorphic SVA F element upstream of SVA F1 insertion.
a, Pairwise sequence alignment dot plot of GRCh38 human reference vs. panTro6 chimpanzee reference at ASIP. The human reference contains an SVA F element upstream of the polymorphic SVA F1 insertion, neither of which are present in chimpanzee. b, Assessment of SVA F presence in 1KGP individuals. Similar to the genotyping approach we used for the polymorphic SVA F1 insertion, we counted reads overlapping the right edge of the SVA F element (indicating presence of at least one allele containing the SVA F) and discordant reads with a fragment size approaching the length of the SVA F element (1.6 kb) (which would indicate the presence of an allele lacking the SVA F). All individuals in 1KGP appear to carry the SVA F on both ASIP alleles.
Extended Data Fig. 7
Extended Data Fig. 7. Construct to measure splicing into upstream SVA F element in vitro.
a, Design of base construct, pCAG-mGL, and relative position of introduced SVA F sequence in the hybrid intron of the CAG promoter at XbaI restriction site. b, Sanger sequencing results from transcripts produced by pCAG-mGL_SVA construct and match to the expected sequence that would arise from splicing from the upstream chicken beta-actin exon (in blue) to the aberrant splice acceptor within the SVA F element (in red) observed in GTEx RNA-seq at ASIP. Note that the sequence is antisense to the transcript. c, Design of RT-ddPCR assays to measure relative splicing from the chicken beta-actin exon to introduced splice acceptor in SVA F versus downstream rabbit beta-globin exon. The arrows represent forward and reverse primers and the rectangles with circles represent quenched fluorescently labeled probes, where the blue circle is a FAM fluorophore, the green circle is a HEX fluorophore, and the gray circles are quenchers that are cleaved during polymerase extension. d, Fraction of splicing into the introduced SVA F element in pCAG-mGL_SVA construct (n = 12 replicates). Each point indicates the measured value in a replicate, with the bar indicating the mean fraction.
Extended Data Fig. 8
Extended Data Fig. 8. Genealogy of haplotypes at the ASIP SVA F1 insertion.
a,b, Coalescent trees estimated by Relate for (a) CEU (n = 202) and (b) GBR (n = 186) haplotypes at the SVA F1 insertion site. The purple branch contains all haplotypes carrying the SVA F1 insertion. Age (in years) on the y-axis assumes a generation time of 28 years.
Extended Data Fig. 9
Extended Data Fig. 9. Associations of SVA F1 insertion and nearby variants to anthropometric phenotypes in UK Biobank.
a-c, Local association plots in a 5-Mb window surrounding ASIP for (a) BMI (n = 169,052), (b) height (n = 169,239), and (c) waist-hip ratio adjusted for BMI (n = 169,285). Only the associations with height reach genome-wide significance, but the association pattern does not appear to colocalize with linkage disequilibrium with the SVA F1 insertion (yellow-to-purple shading).

Similar articles

Cited by

References

    1. Cordaux, R. & Batzer, M. A. The impact of retrotransposons on human genome evolution. Nat. Rev. Genet.10, 691–703 (2009). 10.1038/nrg2640 - DOI - PMC - PubMed
    1. Kojima, S. et al. Mobile element variation contributes to population-specific genome diversification, gene regulation and disease risk. Nat. Genet.55, 939–951 (2023). 10.1038/s41588-023-01390-2 - DOI - PubMed
    1. Xia, B. et al. On the genetic basis of tail-loss evolution in humans and apes. Nature626, 1042–1048 (2024). 10.1038/s41586-024-07095-8 - DOI - PMC - PubMed
    1. Sulem, P. et al. Two newly identified genetic determinants of pigmentation in Europeans. Nat. Genet.40, 835–837 (2008). 10.1038/ng.160 - DOI - PubMed
    1. Brown, K. M. et al. Common sequence variants on 20q11.22 confer melanoma susceptibility. Nat. Genet.40, 838–840 (2008). 10.1038/ng.163 - DOI - PMC - PubMed

LinkOut - more resources