iBet uBet web content aggregator. Adding the entire web to your favor.


Link to original content: http://pubmed.ncbi.nlm.nih.gov/38922775/
Mussel-Derived and Bioclickable Peptide Mimic for Enhanced Interfacial Osseointegration via Synergistic Immunomodulation and Vascularized Bone Regeneration - PubMed Skip to main page content
U.S. flag

An official website of the United States government

Dot gov

The .gov means it’s official.
Federal government websites often end in .gov or .mil. Before sharing sensitive information, make sure you’re on a federal government site.

Https

The site is secure.
The https:// ensures that you are connecting to the official website and that any information you provide is encrypted and transmitted securely.

Access keys NCBI Homepage MyNCBI Homepage Main Content Main Navigation
. 2024 Aug;11(32):e2401833.
doi: 10.1002/advs.202401833. Epub 2024 Jun 23.

Mussel-Derived and Bioclickable Peptide Mimic for Enhanced Interfacial Osseointegration via Synergistic Immunomodulation and Vascularized Bone Regeneration

Affiliations

Mussel-Derived and Bioclickable Peptide Mimic for Enhanced Interfacial Osseointegration via Synergistic Immunomodulation and Vascularized Bone Regeneration

Wei Zhou et al. Adv Sci (Weinh). 2024 Aug.

Abstract

Inadequate osseointegration at the interface is a key factor in orthopedic implant failure. Mechanistically, traditional orthopedic implant interfaces fail to precisely match natural bone regeneration processes in vivo. In this study, a novel biomimetic coating on titanium substrates (DPA-Co/GFO) through a mussel adhesion-mediated ion coordination and molecular clicking strategy is engineered. In vivo and in vitro results confirm that the coating exhibits excellent biocompatibility and effectively promotes angiogenesis and osteogenesis. Crucially, the biomimetic coating targets the integrin α2β1 receptor to promote M2 macrophage polarization and achieves a synergistic effect between immunomodulation and vascularized bone regeneration, thereby maximizing osseointegration at the interface. Mechanical push-out tests reveal that the pull-out strength in the DPA-Co/GFO group is markedly greater than that in the control group (79.04 ± 3.20 N vs 31.47 ± 1.87 N, P < 0.01) and even surpasses that in the sham group (79.04 ± 3.20 N vs 63.09 ± 8.52 N, P < 0.01). In summary, the novel biomimetic coating developed in this study precisely matches the natural process of bone regeneration in vivo, enhancing interface-related osseointegration and showing considerable potential for clinical translation and applications.

Keywords: bone regeneration; immunomodulatory; mussel adhesion; orthopedic implant; tissue adaptation.


Conflict of interest statement

The authors declare no conflict of interest.

Figures
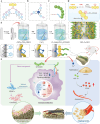
Figure 1
Figure 1
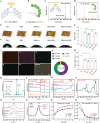
Schematic of the bone implant surface design tailored to the in vivo bone regeneration process. A) (DPA)6‐PEG5‐DBCO (Mussel derived peptide with a bioclickable DBCO group). B) Metal‐catechol coordination. C) 2‐Azido‐(PEG5)‐GFOGER (GFOGER peptide capped with an azide (─N3) group). D) Bioorthogonal click reactions (azide–alkyne cycloaddition reactions). E) Synthesis of a novel biomimetic titanium surface (DPA‐Co/GFO). F) Immunomodulatory synergy with vascularized bone regeneration.
Figure 2
Figure 2
Material characterization of the different modified surfaces. A,B) Schematic representations of the (DPA)6‐PEG5‐DBCO and (2‐Azido)‐PEG5‐GFOGER structures. C,D) ESI‐MS spectra of (DPA)6‐PEG5‐DBCO and (2‐Azido)‐PEG5‐GFOGER. E,F) AFM images of different modified surfaces and quantification of surface roughness. G,H) Water contact angles on the different surfaces and the corresponding quantitative results. I,J) SEM‒EDS elemental mapping and quantitative analysis of the elemental composition of the surface modified with Co2+ and the GFOGER peptide (DPA‐Co/GFO). K) 1H NMR spectra of (DPA)6‐PEG5‐DBCO. L–O) XPS analysis of the different modified surfaces. P) Changes in the N 1 s signal within the XPS spectrum of the DPA‐Co/GFO surface following 2 weeks of incubation in DMEM. Q,R) Accumulative and nonaccumulative release curves of Co2+ from the DPA‐Co/GFO surface in PBS solution and DMEM. The data are presented as the mean ± standard deviation (SD) (n = 3 per group). Statistical analysis was performed by one‐way ANOVA, and *P < 0.05 and **P < 0.01 indicate statistical significance.
Figure 3
Figure 3
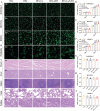
In vitro and in vivo biocompatibility of the different modified surfaces. A) Live/dead cell staining of RAW264.7 cells, HUVECs, and BMSCs on the different modified surfaces. B) Cytoskeletal staining (FITC‐phalloidin/DAPI) of BMSCs on the different modified surfaces. C) HE staining of rat viscera (heart, liver, spleen, lung, kidney) two months after the implantation of different modified titanium rods. D–F) CCK‐8 assays of RAW264.7 cells, HUVECs and BMSCs cultured on the different modified surfaces for 1 and 3 d. G–I) LDH cytotoxicity assays of RAW264.7 cells, HUVECs and BMSCs cultured on the different modified surfaces. The data are presented as the mean ± standard deviation (SD); n = 5 per group. Statistical analysis was performed by one‐way ANOVA ( P < 0.05 and ∗∗ P < 0.01 versus the TiO2 group; # P < 0.05 and ## P < 0.01 versus the DPA group; & P < 0.05 and && P < 0.01 versus the DPA‐Co group).
Figure 4
Figure 4
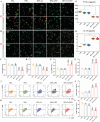
Regulation of macrophage polarization by the different modified surfaces in vitro. A,B) Immunofluorescence staining was used to evaluate macrophage polarization in RAW264.7 cells cultured on the different modified surfaces (green: phalloidin‐stained cytoskeleton; red: markers of M1 macrophages (CD86 and iNOS) and M2 macrophages (CD206 and Arg‐1); blue: nuclei). C–F) Quantitative results of immunofluorescence staining of the corresponding markers. G,H) ELISA was used to measure the secretion of the proinflammatory cytokine TNF‐α and the anti‐inflammatory cytokine IL‐10 by RAW264.7 cells cultured on the different modified surfaces. I–K) Flow cytometry was used to analyze the expression of CD86 (an M1 marker) and CD206 (an M2 marker) in RAW264.7 cells cultured on the different modified surfaces, and the results were quantified. The data are presented as the mean ± standard deviation (SD) (n = 3 or 5 per group). Statistical analysis was performed by one‐way ANOVA ( P < 0.05 and ∗∗ P < 0.01 vs the TiO2 group; # P < 0.05 and ## P < 0.01 versus the DPA group; & P < 0.05 and && P < 0.01 versus the DPA‐Co group).
Figure 5
Figure 5
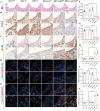
Regulation of macrophage polarization by the different modified surfaces in vivo. A) H&E staining of peri‐implant tissue in the femur 5 d after implantation and F) quantitative analysis of the thickness of the fibrous layer. B,C) Immunohistochemical staining of peri‐implant tissue to examine TNF‐α and IL‐10 expression, and G,H) the quantitative results of the corresponding positive areas are shown. D,E) Immunofluorescence staining of peri‐implant tissue to assess macrophage polarization status (green: macrophage‐specific marker (CD68); red: marker of M1 macrophages (CD86); and blue: nucleus of M2 macrophages (CD206)). I,J) The quantitative results are shown for positive cells. The data are presented as the mean ± standard deviation (SD) (n = 5 per group). Statistical analysis was performed by one‐way ANOVA, and *P < 0.05 and **P < 0.01 indicate statistical significance.
Figure 6
Figure 6
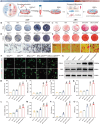
Direct and indirect osteogenic effects of GFOGER‐modified surfaces in vitro. A) Schematic diagram of the experimental design. B,C) BMSCs were cultured on different modified titanium surfaces, and ALP and ARS staining were used to assess the direct osteogenic effects. H,I) Quantitative analysis of the corresponding positive areas. D,E) BMSCs were cultured in macrophage‐conditioned medium (MCM) to investigate the indirect osteogenic effects (immunomodulation‐promoting osteogenesis) of the different modified surfaces, as shown by ALP and ARS staining, after which J,K) quantitative analysis was performed. F) Immunofluorescence staining was performed on BMSCs cultured in MCM, and the corresponding cells L,M) were subjected to quantitative analysis (green: phalloidin‐stained cytoskeleton; red: osteogenic markers (OPN and COL‐I); blue: nuclei). G) Western blot analysis of osteogenic markers and N,O) the quantitative results. The data are presented as the mean ± standard deviation (SD) (n = 3 or 5 per group). Statistical analysis was performed by one‐way ANOVA ( P < 0.05 and ∗∗ P < 0.01 vs the TiO2 group; # P < 0.05 and ## P < 0.01 vs the DPA group; & P < 0.05 and && P < 0.01 vs the DPA‐Co group).
Figure 7
Figure 7
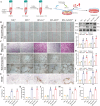
The release of Co2+ from modified surfaces (DPA‐Co and DPA‐Co/GFO) promotes angiogenesis. A) Schematic diagram of the experimental design. B) Wound healing assays were performed on HUVECs following 24 h of exposure to leach solutions from the different modified surfaces, and the corresponding G) quantitative data are shown. C) Transwell assays were performed on HUVECs after 24 h of incubation in leach solutions derived from different modified surfaces, and the corresponding K) quantitative data were collected. D) Tube formation assays were performed on HUVECs after 4 and 24 h of treatment with the leach solution, and the corresponding G–I) quantitative data were obtained. E) Immunohistochemical staining of the angiogenic marker VEGF in peri‐implant tissue and L) quantification of the corresponding positive area. Western blot analysis of osteogenic markers and N–O) the quantitative results. F) Western blot analysis of VEGF and HIF‐1α in the different groups and M,N) quantification results. The data are presented as the mean ± standard deviation (SD) (n = 3 or 5 per group). Statistical analysis was performed by one‐way ANOVA ( P < 0.05 and ∗∗ P < 0.01 versus the TiO2 group; # P < 0.05 and ## P < 0.01 vs the DPA group; & P < 0.05 and && P < 0.01 vs the DPA‐Co group; $ P < 0.05 and $$ P < 0.01 vs the DPA‐GFO group).
Figure 8
Figure 8
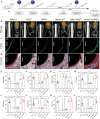
Evaluation of osseointegration around the different modified titanium rods. A) Animal experiment flowchart. B) Micro‐CT 3D reconstruction images and E–‐I) quantitative analysis of bone regeneration indices around the implant (BMD, BV/TV, BS/BV, Tb.​ N, and Tb.Th). C) Calcein fluorescence images of hard tissue sections and J) quantitative analysis of the mineral apposition rate (MAR). D) Van Gieson staining of hard tissue sections and K) quantitative analysis of the bone‐implant contact (BIC) are shown. L) Biomechanical pull‐out tests were performed to evaluate the maximum fixation force in the different groups. The data are presented as the mean ± standard deviation (SD) (n = 5 per group). Statistical analysis was performed by one‐way ANOVA, and *P < 0.05 and **P < 0.01 indicate statistical significance.
Figure 9
Figure 9
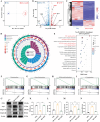
Transcriptome sequencing reveals the mechanisms by which DPA‐Co/GFO regulates M2 macrophage polarization. A) Principal component analysis (PCA) of DEGs in the TiO2 and DPA‐Co/GFO groups. B) Volcano plots of DEGs. C) Heatmap of DEGs. D) Gene Ontology (GO) enrichment analysis of DEGs in RAW264.7 cells cultured on DPA‐Co/GFO versus TiO2. E) The top 20 enriched pathways according to the Kyoto Encyclopedia of Genes and Genomes (KEGG) database (downregulation). F–I) Gene set enrichment analysis (GSEA) of the TNF, NF‐κB, NOD‐like, and IL‐17 signaling pathways. G) Western blot analysis to verify the role of DPA‐Co/GFO in targeting integrin receptor‐mediated regulation of M2 macrophage polarization (iNOS: M1 macrophage marker, Arg‐1: M2 macrophage marker, BTT‐3033: specific inhibitor of integrin α2β1). The data are presented as the mean ± standard deviation (SD) (n = 3 per group). Statistical analysis was performed by one‐way ANOVA, and *P < 0.05 and **P < 0.01 indicate statistical significance.

Similar articles

References

    1. Ferguson R. J., Palmer A. J., Taylor A., Porter M. L., Malchau H., Glyn‐Jones S., Lancet 2018, 392, 1662. - PubMed
    1. Qiu L., Zhu Z., Peng F., Zhang C., Xie J., Zhou R., Zhang Y., Li M., ACS Omega 2022, 7, 12030. - PMC - PubMed
    1. Monte F. A. D., Awad K. R., Ahuja N., Kim H. K. W., Aswath P., Brotto M., Varanasi V. G., Tissue Eng., Part A 2020, 26, 15. - PMC - PubMed
    1. Corcuera‐Flores J. R., Alonso‐Domínguez A. M., Serrera‐Figallo M., Torres‐Lagares D., Castellanos‐Cosano L., Machuca‐Portillo G., J. Periodontol. 2016, 87, 14. - PubMed
    1. Takeshita F., Murai K., Iyama S., Ayukawa Y., Suetsugu T., J. Periodontol. 1998, 69, 314. - PubMed

MeSH terms

LinkOut - more resources