iBet uBet web content aggregator. Adding the entire web to your favor.


Link to original content: http://pubmed.ncbi.nlm.nih.gov/38910207/
FGF signaling modulates mechanotransduction/WNT signaling in progenitors during tooth root development - PubMed Skip to main page content
U.S. flag

An official website of the United States government

Dot gov

The .gov means it’s official.
Federal government websites often end in .gov or .mil. Before sharing sensitive information, make sure you’re on a federal government site.

Https

The site is secure.
The https:// ensures that you are connecting to the official website and that any information you provide is encrypted and transmitted securely.

Access keys NCBI Homepage MyNCBI Homepage Main Content Main Navigation
. 2024 Jun 24;12(1):37.
doi: 10.1038/s41413-024-00345-5.

FGF signaling modulates mechanotransduction/WNT signaling in progenitors during tooth root development

Affiliations

FGF signaling modulates mechanotransduction/WNT signaling in progenitors during tooth root development

Fei Pei et al. Bone Res. .

Abstract

Stem/progenitor cells differentiate into different cell lineages during organ development and morphogenesis. Signaling pathway networks and mechanotransduction are important factors to guide the lineage commitment of stem/progenitor cells during craniofacial tissue morphogenesis. Here, we used tooth root development as a model to explore the roles of FGF signaling and mechanotransduction as well as their interaction in regulating the progenitor cell fate decision. We show that Fgfr1 is expressed in the mesenchymal progenitor cells and their progeny during tooth root development. Loss of Fgfr1 in Gli1+ progenitors leads to hyperproliferation and differentiation, which causes narrowed periodontal ligament (PDL) space with abnormal cementum/bone formation leading to ankylosis. We further show that aberrant activation of WNT signaling and mechanosensitive channel Piezo2 occurs after loss of FGF signaling in Gli1-CreER;Fgfr1fl/fl mice. Overexpression of Piezo2 leads to increased osteoblastic differentiation and decreased Piezo2 leads to downregulation of WNT signaling. Mechanistically, an FGF/PIEZO2/WNT signaling cascade plays a crucial role in modulating the fate of progenitors during root morphogenesis. Downregulation of WNT signaling rescues tooth ankylosis in Fgfr1 mutant mice. Collectively, our findings uncover the mechanism by which FGF signaling regulates the fate decisions of stem/progenitor cells, and the interactions among signaling pathways and mechanotransduction during tooth root development, providing insights for future tooth root regeneration.


Conflict of interest statement

The authors declare no competing interests.

Figures

Fig. 1
Fig. 1
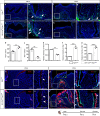
Fgfr1 is expressed in Gli1+ progenitor cells and their progeny during tooth root development. ah Expression of Fgfr1 in mandibular first molars from wild-type mice at PN3.5, PN7.5, PN14 and PN28. White arrows point to the expression of Fgfr1 in apical papilla and odontoblasts; yellow arrows point to the expression of Fgfr1 in follicle cells. il Expression of Fgfr1 and tdTomato at PN18 in Gli1-CreER;tdT mouse model. White arrows point to the expression of Fgfr1 in periodontal ligament; white arrowheads point to the expression of Fgfr1 in odontoblasts. PDL, periodontal ligament; OD, odontoblasts; DPC, dental pulp cells. White dashed lines outline Hertwig’s epithelial root sheath (HERS). Scale bars, 100 μm
Fig. 2
Fig. 2
Loss of Fgfr1 in Gli1+ progenitor cells leads to tooth ankylosis. af MicroCT analysis of the first mandibular molars in Fgfr1fl/fl and Gli1-CreER;Fgfr1fl/fl mice at PN30, PN60, and postnatal 9 months (PN9M). White arrowheads point to the periodontal ligament space; white arrows point to the narrowed periodontal ligament space; white asterisk points to the narrowed root pulp cavity. gi Relative periodontal ligament space in control and Fgfr1 mutant mice at PN30, PN60, and postnatal 9 months (PN9M). P < 0.000 1, unpaired Student’s t-test, n = 3 and each point represents one animal. jl Relative tooth root pulp cavity area in control and Fgfr1 mutant mice at PN30, PN60, and postnatal 9 months (PN9M). j P = 0.017 5, k, l P < 0.000 1, unpaired Student’s t-test, n = 3 and each point represents one animal. mn MicroCT overlays: superimposition of control (white) and Gli1-CreER;Fgfr1fl/fl (blue) mouse mandibles. o, q Overlay of the mandibular first molars of control (white) and Gli1-CreER;Fgfr1fl/fl (blue) using the mandibular border as reference. p, r Overlay of the mandibular first molars of control (white) and Gli1-CreER;Fgfr1fl/fl (blue) using the crown as reference. s, t Relative tooth eruption in control and Fgfr1 mutant mice at PN60 and postnatal 9 months (PN9M). s P = 0.000 9, t P = 0.000 2. n = 3 and each point represents one animal, with an unpaired Student’s t-test performed. Schematic at the bottom indicates the induction protocol. *P < 0.05, ***P < 0.001, ****P < 0.000 1, Scale bars, 1 mm
Fig. 3
Fig. 3
Narrowed PDL space with ankylosed tooth root in Gli1-CreER;Fgfr1fl/fl mice. ad Histological analysis of Fgfr1fl/fl and Gli1-CreER;Fgfr1fl/fl mice at PN30. Black arrows point to abnormal cementum. Black dashed lines outline the interface between root dentin and cementum. eh Expression of Dspp and periostin in Fgfr1fl/fl and Gli1-CreER;Fgfr1fl/fl mice. White arrows point to abnormal periodontal ligaments. il Histological analysis of Fgfr1fl/fl and Gli1-CreER;Fgfr1fl/fl mice at PN60. The black asterisk points to periodontal ligament space; the black arrowhead points to narrowed periodontal ligament space in furcation; the black arrow points to the absence of periodontal ligament space where the tooth root connects to alveolar bone; Line with arrows indicates root pulp cavity. mp Periostin expression in Fgfr1fl/fl and Gli1-CreER;Fgfr1fl/fl mice at PN60. The white asterisk points to the periodontal ligament; the white arrow points to the absence of periostin expression. The Schematic at the bottom indicates the induction protocol. Scale bars, b, d, f, h, j, l, n, p, 100 μm; others, 500 μm
Fig. 4
Fig. 4
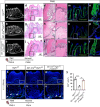
Loss of Fgfr1 leads to hyperproliferation and differentiation of Gli1+ progenitor cells. ad, fi Proliferating cells stained with Ki67 in Fgfr1fl/fl and Gli1-CreER;Fgfr1fl/fl mice at PN7.5 and PN14. The white arrow points to Ki67+ cells in the papilla and follicle. e, j Quantification of Ki67+ cells in control and Fgfr1 mutant mice at PN7.5 and PN14. e P = 0.007 3, j P = 0.001 5, n = 3, and each point represents one animal, with unpaired Student’s t-test performed. kn Expression of Pthlh in control and Fgfr1 mutant mice at PN14. The white arrow points to cementoblasts expressing Pthlh along the tooth root surface. o Quantification of Pthlh+ cells in control and Fgfr1 mutant mice at PN14. P = 0.000 8, n = 3, and each point represents one animal, with unpaired Student’s t-test performed. ps Expression of Ibsp and Sp7 in control and Fgfr1 mutant mice at PN14. The white arrowhead points to cementoblasts expressing Ibsp and Sp7 along the tooth root surface; the white arrow points to increased Ibsp and Sp7 in cementoblasts and periodontium. t, u Quantification of Ibsp+ and Sp7+ cells in control and Fgfr1 mutant mice at PN14. t P = 0.000 4, (u) P = 0.000 5, n = 3, and each point represents one animal, with unpaired Student’s t-test performed. The Schematic at the bottom indicates the induction protocol. **P < 0.01, ***P < 0.001, Scale bars, 100 μm
Fig. 5
Fig. 5
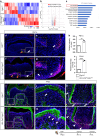
Loss of FGF signaling in tooth root mesenchymal progenitors leads to increased WNT signaling. a Hierarchical clustering showing the gene expression profiles of control and Gli1-CreER;Fgfr1fl/fl mice. Z-scores were used to compare expression levels between samples. b Volcano plot showing 1 043 upregulated genes and 309 downregulated genes in Fgfr1 mutant relative to control. c GO analysis showing the signaling pathways involved. dg Expression of Axin2 in Fgfr1fl/fl and Gli1-CreER;Fgfr1fl/fl mice at PN7.5. White and yellow arrows point to the expression of Axin2 in the dental papilla surrounding HERS and furcation region; white and yellow arrowheads point to increased Axin2 in the dental papilla, follicle, and furcation region. Orange boxes in d and f indicate furcation region and are shown enlarged in orange dashed insets in e and g. White boxes in (d) and (f) are shown enlarged as (e) and (g), respectively. White dashed lines outline HERS. h Relative fluorescent intensity of Axin2 at PN7.5 and PN14. (PN7.5) P = 0.001 7, (PN14) P < 0.000 1, n = 3, and each point represents one animal, with unpaired Student’s t-test performed. in Expression of Axin2 and Col1a1 in Fgfr1fl/fl and Gli1-CreER;Fgfr1fl/fl mice at PN14. White arrows point to the expression of Axin2 in apical papilla and periodontium; white arrowheads point to the increased expression of Axin2. The white dashed line indicates the interface between the papilla and follicle. The Schematic at the bottom indicates the induction protocol. **P < 0.01, ****P < 0.000 1. Scale bars, 100 μm
Fig. 6
Fig. 6
FGF signaling modulates mechanotransduction genes Piezo2 to regulate differentiation of progenitors and WNT signaling. af Expression of Piezo2 in Fgfr1fl/fl and Gli1-CreER;Fgfr1fl/fl mice at PN7.5. White arrowheads point to the expression of Piezo2 in the apical papilla and follicle; white arrows point to increased Piezo2 in the apical, middle, and coronal papilla and apical follicle. White dashed lines outline HERS. The Schematic at the bottom indicates the induction protocol. g Relative expression of Piezo2 in pCMV6 and pPiezo2-treated group with qPRC in vitro. P = 0.000 3, unpaired Student’s t-test, n = 3 and each point represents one biological replicate. hk Expression of Piezo2 and Ibsp in pCMV6- and pPiezo2-treated apical mesenchymal cells from control mice. lq Mineralized nodules with Alizarin red staining in control, pCMV6- and pPiezo2-treated apical mesenchymal cells from control mice. r Quantification of calcium deposition in the three groups. P < 0.000 1, one-way ANOVA, n = 3 biologically independent samples. s, t Knockdown of Piezo2 in apical mesenchymal cells from Gli1-CreER;Fgfr1fl/fl mice with Piezo2 siRNA treatment. u, v Expression of Ctnnb1 after Piezo2 siRNA treatment. ***P < 0.001, ****P < 0.000 1. Scale bars, 100 μm
Fig. 7
Fig. 7
FGF/ETV5 signaling regulates Piezo2 expression. a Prediction of ETV5 binding with Piezo2 promoter region. b ChIP-qPCR showed that ETV5 can bind to the genomic locus of Piezo2. P = 0.023 1, unpaired Student’s t-test, n = 3, and each point represents one biological replicate. cf Expression of Etv5 in Fgfr1fl/fl and Gli1-CreER;Fgfr1fl/fl mice at PN7.5. White arrows point to the expression of Etv5. White dashed lines outline HERS. g Relative expression of Etv5 in Negative control (NC) and Etv5 siRNA-treated apical mesenchymal cells with qPRC in vitro. P < 0.000 1, unpaired Student’s t-test, n = 3 and each point represents one biological replicate. h, i Expression of Etv5 in NC and Etv5 siRNA-treated group. j, k Expression of Piezo2 in NC and Etv5 siRNA-treated group. *P < 0.05, ****P < 0.000 1. Scale bars, 100 μm
Fig. 8
Fig. 8
Downregulation of WNT signaling rescues tooth ankylosis in Gli1-CreER;Fgfr1fl/fl mice. ac MicroCT analysis of the first mandibular molars in Fgfr1fl/fl, Gli1-CreER;Fgfr1fl/fl and Gli1-CreER;Fgfr1fl/fl;β-cateninfl/+ mice at PN50. White arrows point to the periodontal ligament space; white arrowheads point to the narrowed periodontal ligament space. dl Histological analysis of Fgfr1fl/fl, Gli1-CreER;Fgfr1fl/fl and Gli1-CreER;Fgfr1fl/fl;β-cateninfl/+ mice. mr Periostin expression in Fgfr1fl/fl, Gli1-CreER;Fgfr1fl/fl and Gli1-CreER;Fgfr1fl/fl;β-cateninfl/+ mice. Space between white dashed lines (n, p, and r) indicates periodontal ligament space. sx Proliferation stained with Ki67 in Fgfr1fl/fl, Gli1-CreER;Fgfr1fl/fl and Gli1-CreER;Fgfr1fl/fl;β-cateninfl/+ mice. White arrows point to Ki67+ cells. y Quantification of Ki67+ cells in three groups. Fgfr1fl/fl versus Gli1-CreER;Fgfr1fl/fl: P = 0.000 4; Gli1-CreER;Fgfr1fl/fl versus Gli1-CreER;Fgfr1fl/fl;β-cateninfl/+: P = 0.001, n = 3 biologically independent samples, with one-way ANOVA performed. The Schematic at the bottom indicates the induction protocol. **P < 0.01, ***P < 0.001. Scale bars, ac, 1 mm; d, g, j, m, o, q, 500 μm; others, 100 μm
Fig. 9
Fig. 9
Schematic of FGF signaling in progenitor cells regulating mechanotransduction and WNT signaling to modulate proliferation and differentiation during tooth root development. Loss of Fgfr1 in Gli1+ progenitor cells leads to increased and ectopic Piezo2 expression, which activates WNT signaling through Fzd6/β-catenin and Piezo2/β-catenin. Schematic was created with BioRender

Similar articles

References

    1. Scadden DT. The stem-cell niche as an entity of action. Nature. 2006;441:1075–1079. doi: 10.1038/nature04957. - DOI - PubMed
    1. Yuan Y, et al. Spatiotemporal cellular movement and fate decisions during first pharyngeal arch morphogenesis. Sci. Adv. 2020;6:eabb0119. doi: 10.1126/sciadv.abb0119. - DOI - PMC - PubMed
    1. van der Kooy D, Weiss S. Why stem cells? Science. 2000;287:1439–1441. doi: 10.1126/science.287.5457.1439. - DOI - PubMed
    1. Vining KH, Mooney DJ. Mechanical forces direct stem cell behaviour in development and regeneration. Nat. Rev. Mol. Cell Biol. 2017;18:728–742. doi: 10.1038/nrm.2017.108. - DOI - PMC - PubMed
    1. Jing JJ, et al. Spatiotemporal single-cell regulatory atlas reveals neural crest lineage diversification and cellular function during tooth morphogenesis. Nat. Commun. 2022;13:4803. doi: 10.1038/s41467-022-32490-y. - DOI - PMC - PubMed

MeSH terms

Substances