iBet uBet web content aggregator. Adding the entire web to your favor.


Link to original content: http://pubmed.ncbi.nlm.nih.gov/38895486/
Refinement of efficient encodings of movement in the dorsolateral striatum throughout learning - PubMed Skip to main page content
U.S. flag

An official website of the United States government

Dot gov

The .gov means it’s official.
Federal government websites often end in .gov or .mil. Before sharing sensitive information, make sure you’re on a federal government site.

Https

The site is secure.
The https:// ensures that you are connecting to the official website and that any information you provide is encrypted and transmitted securely.

Access keys NCBI Homepage MyNCBI Homepage Main Content Main Navigation
[Preprint]. 2024 Jun 6:2024.06.06.596654.
doi: 10.1101/2024.06.06.596654.

Refinement of efficient encodings of movement in the dorsolateral striatum throughout learning

Affiliations

Refinement of efficient encodings of movement in the dorsolateral striatum throughout learning

Omar Jáidar et al. bioRxiv. .

Abstract

The striatum is required for normal action selection, movement, and sensorimotor learning. Although action-specific striatal ensembles have been well documented, it is not well understood how these ensembles are formed and how their dynamics may evolve throughout motor learning. Here we used longitudinal 2-photon Ca2+ imaging of dorsal striatal neurons in head-fixed mice as they learned to self-generate locomotion. We observed a significant activation of both direct- and indirect-pathway spiny projection neurons (dSPNs and iSPNs, respectively) during early locomotion bouts and sessions that gradually decreased over time. For dSPNs, onset- and offset-ensembles were gradually refined from active motion-nonspecific cells. iSPN ensembles emerged from neurons initially active during opponent actions before becoming onset- or offset-specific. Our results show that as striatal ensembles are progressively refined, the number of active nonspecific striatal neurons decrease and the overall efficiency of the striatum information encoding for learned actions increases.


Figures
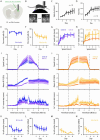
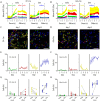
Figure 1 –
Figure 1 –. Striatal activation decreases throughout learning.
A, Illustration of stereotaxic injection of AAV delivery of GCaMP6s into the DLS of D1-Cre or A2a-Cre mice followed by GRIN lens implantation. B, Schematic of 2-photon imaging during head-restrained, self-generated locomotion paradigm. Bottom: DLS longitudinal imaging, scale bar: 100μm. C, Average velocity of mice throughout each session (n = 10 mice; p = 0.030). D, Average time spent running (n = 10 mice; p < 0.0001) depicting a progressive increase in self-generated locomotion across days. E, F, Percentage of imaged neurons that were positively modulated during periods of locomotion (relative to periods of non-locomotion) for dSPNs (E; n = 5 mice; p = 0.475) and iSPNs (F; n = 5 mice; p = 0.030). G, H, SPN activity (event rate) plotted as a function of locomotion speed, averaged across ‘early’ and ‘late’ sessions for dSPNs (G; n = 5 mice; p = 0.971) and iSPNs (H; n = 5 mice; p = 0.011). I, J, Left: dSPN summary, right: iSPN summary. Top: average animal locomotion speed centered around motion onsets and offsets. Middle: average standardized dF/F activity of imaged SPNs centered around motion onsets and offsets. Bottom: average Ca2+ event rate (normalized) of imaged SPNs centered around motion onsets and offsets. All analyses compare average between ‘early’ and ‘late’ sessions. K-N, Across-day percentages of dSPNs active during motion onsets (K, n = 5 mice / 8 days / 298 onsets; p = 0.003), offsets (L, n = 5 mice / 8 days / 314 offsets; p = 0.005), iSPNs active during motion onsets (M, n = 5 mice / 8 days / 320 onsets; p = 0.008), and offsets (N, n = 5 mice / 8 days / 320 offsets; p = 1.343e-04). Data are mean ± SEM. Statistical significance was assessed by repeated measures 1-way ANOVA with multiple comparisons (C-F), 2-way repeated measured ANOVA with multiple comparisons (G, H), linear mixed-effects modeling (K-N).
Figure 2 –
Figure 2 –. Specific decrease in the proportion of movement-nonspecific SPNs with learning.
A, B, Average activity (standardized dF/F) of dSPNs (A) and iSPNs (B) where SPNs are categorized as being active only during motion onsets (‘onset only’, green), offsets (‘offset only’, red), active during both onsets and offsets (‘both’, yellow), or not active during either onsets or offsets (‘neither’, blue). Left- and right-side halves of panels depict average SPN activity during ‘early’ or ‘late’ sessions, respectively. C, D, Representative images of SPN locomotion activation types during session 1 (left) or session 8 (right). Scale bars: 100μm. E, Percentage of dSPNs across days that belong to the categories of ‘onset only’ (green; n = 5 mice / 8 days / 296 bouts; p = 0.462), ‘offset only’ (red; n = 5 mice / 8 days / 296 bouts; p = 0.167), ‘both’ (yellow; n = 5 mice / 8 days / 296 bouts; p = 1.905e-08), and ‘neither’ (blue; n = 5 mice / 8 days / 296 bouts; p = 2.605e-05). F, Percentage of iSPNs across days that belong to the categories of ‘onset only’ (green; n = 5 mice / 8 days / 318 bouts; p = 0.233), ‘offset only’ (red; n = 5 mice / 8 days / 318 bouts; p = 0.008), ‘both’ (yellow; n = 5 mice / 8 days / 318 bouts; p = 2.134e-05), and ‘neither’ (blue; n = 5 mice / 8 days / 318 bouts; p = 3.286e-08). G, H, Average activation types for ‘early’ (days 1+2) vs. ‘late’ (days 7+8) periods of learning. Data are mean ± SEM. Statistical significance was assessed by linear mixed-effects modeling (E, F).
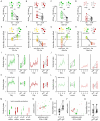
Figure 3 –
Figure 3 –. Refinement of movement-specific SPN ensembles throughout learning.
A, B, Percentage of ‘late’ stage (days 7+8) onset (A) and offset (B) dSPN ensembles that were significantly active during ‘early’ stages (days 1+2). Left: observed activation overlap (obs), right: average overlap of 1000 shuffled activation vectors (shuff, see Methods) (n = 5 animals; dSPN onset: p = 0.042; dSPN offset: p = 0.006). C, D, Percentage of ‘late’ stage (days 7+8) onset (C) and offset (D) iSPN ensembles that were significantly active during ‘early’ stages (days 1+2). Left: observed activation overlap (obs), right: average overlap of 1000 shuffled activation vectors (shuff, see Methods) (n = 4 animals; iSPN onset: p = 0.104; iSPN offset: p = 0.927). E, F, Early vs. late Activation Bias averaged for each animal (across all dSPNs) for onset-specific (E; n = 5 animals; p = 0.007) and offset-specific (F; n = 5 animals; p = 0.026) dSPN ensembles. G, H, Early vs. late Activation Bias averaged for each animal (across all iSPNs) for onset-specific (G; n = 4 animals; p = 0.125) and offset-specific (H; n = 4 animals; p = 0.015) iSPN ensembles. I, Within-day Similarity Indices for onset-specific dSPN ensembles (green; n = 5 mice / 8 days / 381 onsets; p = 0.048) and offset-specific dSPN ensembles (red; n = 5 mice / 8 days / 401 offsets; p = 0.013) comparing bouts within days. J, Across-day Similarity Indices for onset-specific dSPN ensembles (green; 5 mice / 8 days / 174 onsets; p = 0.008) and offset-specific dSPN ensembles (red; n = 5 mice / 8 days / 174 offsets; p = 0.049) comparing bouts across days. K, Within-day Similarity Indices for onset-specific iSPN ensembles (green; n = 4 mice / 8 days / 379 onsets; p = 0.128) and offset-specific iSPN ensembles (red; n = 4 mice / 8 days / 373 offsets; p = 0.006) comparing bouts within days. L, Across-day Similarity Indices for onset-specific iSPN ensembles (green; 4 mice / 8 days / 140 onsets; p = 0.190) and offset-specific iSPN ensembles (red; n = 4 mice / 8 days / 140 offsets; p = 0.752). I-L, Right: box plots depicting summary of ‘early’ (days 1+2) vs. ‘late’ (days 7+8) average (per animal) Similarity Indices. M, Comparison of ‘early’ Similarity Indices between SPN types (‘within’ and ‘across’ days) (onset ‘within’ p = 0.004; offset ‘within’ p = 0.218; onset ‘across’ p = 0.009; offset ‘across’ p = 0.006). N, Representative PCA + tSNE dimensionality reduction of an animal’s dSPN population Ca2+ activity across bouts of onsets (green) and offsets (red), with ‘early’ (days 1+2) bouts depicted in lighter colors and ‘later’ (days 7+8) bouts depicted in darker colors. O, Separability Score (onsets vs. offsets) of all D1-Cre animals comparing the ‘early’ to ‘late’ stage dSPN population separability of actions (n = 5 mice; p = 0.046). P, Representative PCA + tSNE dimensionality reduction of an animal’s iSPN population Ca2+ activity across bouts of onsets (green) and offsets (red), with ‘early’ (days 1+2) bouts depicted in lighter colors and ‘later’ (days 7+8) bouts depicted in darker colors. Q, Separability Score (onsets vs. offsets) of all A2a-Cre animals comparing the ‘early’ to ‘late’ stage iSPN population separability of actions (n = 5 mice; p = 0.255). Data are mean ± SEM. Box plots are depicted as mean (center), first/third quartile (lower/upper box limits), and minima/maxima (bottom/top whiskers). Statistical significance was assessed by two-sided paired t-tests (A-H, O, Q), linear mixed-effects modeling (I-L), and two-sided unpaired t-tests (M).
Figure 4 –
Figure 4 –. Striatal movement-specific activity becomes more efficient throughout learning.
A, B, Average predictive performance across days of action-specific linear regression models fitting dSPN Ca2+ activity to animal velocity, trained on subsets of onsets (A; n = 5 mice; p = 0.420) or offsets (B; n = 5 mice; p = 0.142). C, D, Average predictive performance across days of action-specific linear regression models fitting iSPN Ca2+ activity to animal velocity, trained on subsets of onsets (C; n = 5 mice; p = 0.470) or offsets (D; n = 5 mice; p = 0.544). E, F, Model performance of action-specific (onset-specific, E; offset-specific, F) linear regression models trained on subsets of dSPNs of varying sizes (see Methods; onsets: n = 5 mice, p = 0.474; offsets: p = 0.982). G, H, Model performance of action-specific (onset-specific, G; offset-specific, H) linear regression models trained on subsets of iSPNs of varying sizes (see Methods; onsets: n = 5 mice, p = 0.841; offsets: p = 0.337). I, J, Average ‘Efficiency Score’ (see Methods) plotted for dSPN encodings of onsets (I; n = 5 mice; p = 0.017) or offsets (J; n = 5 mice; p = 0.074). K, L, Average ‘Efficiency Score’ (see Methods) plotted for iSPN encodings of onsets (K; n = 5 mice; p = 0.049) or offsets (L; n = 5 mice; p = 0.128). I-L, Right: comparison of ‘early’ (days 1+2) vs. ‘late’ (days 7+8) stage ‘Efficiency Scores’. Data are mean ± SEM. Box plots are depicted as mean (center), first/third quartile (lower/upper box limits), and minima/maxima (bottom/top whiskers). Statistical significance was assessed by repeated measures 1-way ANOVA with multiple comparisons (A-D), 2-way repeated measured ANOVA with multiple comparisons (E-H), and two-sided paired t-tests (I-L).

Similar articles

References

    1. Albarran E., Raissi A., Jáidar O., Shatz C. J., & Ding J. B. (2021). Enhancing motor learning by increasing the stability of newly formed dendritic spines in the motor cortex. Neuron, 109(20), 3298–3311. - PMC - PubMed
    1. Albarran E., Sun Y., Liu Y., Raju K., Dong A., Li Y., … & Ding J. B. (2023). Postsynaptic synucleins mediate endocannabinoid signaling. Nature Neuroscience, 26(6), 997–1007. - PMC - PubMed
    1. Arber S., & Costa R. M. (2022). Networking brainstem and basal ganglia circuits for movement. Nature Reviews Neuroscience, 23(6), 342–360. - PubMed
    1. Athalye V. R., Santos F. J., Carmena J. M., & Costa R. M. (2018). Evidence for a neural law of effect. Science, 359(6379), 1024–1029. - PubMed
    1. Bailey K. R., & Mair R. G. (2006). The role of striatum in initiation and execution of learned action sequences in rats. Journal of Neuroscience, 26(3), 1016–1025. - PMC - PubMed

Publication types

LinkOut - more resources