iBet uBet web content aggregator. Adding the entire web to your favor.


Link to original content: http://pubmed.ncbi.nlm.nih.gov/38755139/
Sequential glycosylations at the multibasic cleavage site of SARS-CoV-2 spike protein regulate viral activity - PubMed Skip to main page content
U.S. flag

An official website of the United States government

Dot gov

The .gov means it’s official.
Federal government websites often end in .gov or .mil. Before sharing sensitive information, make sure you’re on a federal government site.

Https

The site is secure.
The https:// ensures that you are connecting to the official website and that any information you provide is encrypted and transmitted securely.

Access keys NCBI Homepage MyNCBI Homepage Main Content Main Navigation
. 2024 May 16;15(1):4162.
doi: 10.1038/s41467-024-48503-x.

Sequential glycosylations at the multibasic cleavage site of SARS-CoV-2 spike protein regulate viral activity

Affiliations

Sequential glycosylations at the multibasic cleavage site of SARS-CoV-2 spike protein regulate viral activity

Shengjun Wang et al. Nat Commun. .

Abstract

The multibasic furin cleavage site at the S1/S2 boundary of the spike protein is a hallmark of SARS-CoV-2 and plays a crucial role in viral infection. However, the mechanism underlying furin activation and its regulation remain poorly understood. Here, we show that GalNAc-T3 and T7 jointly initiate clustered O-glycosylations in the furin cleavage site of the SARS-CoV-2 spike protein, which inhibit furin processing, suppress the incorporation of the spike protein into virus-like-particles and affect viral infection. Mechanistic analysis reveals that the assembly of the spike protein into virus-like particles relies on interactions between the furin-cleaved spike protein and the membrane protein of SARS-CoV-2, suggesting a possible mechanism for furin activation. Interestingly, mutations in the spike protein of the alpha and delta variants of the virus confer resistance against glycosylation by GalNAc-T3 and T7. In the omicron variant, additional mutations reverse this resistance, making the spike protein susceptible to glycosylation in vitro and sensitive to GalNAc-T3 and T7 expression in human lung cells. Our findings highlight the role of glycosylation as a defense mechanism employed by host cells against SARS-CoV-2 and shed light on the evolutionary interplay between the host and the virus.


Conflict of interest statement

The authors declare no competing interest.

Figures
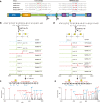
Fig. 1
Fig. 1. The multibasic cleavage site of SARS-CoV-2 spike protein is glycosylated sequentially by GalNAc-T3 and T7 in vitro.
a The domain structure of SARS-CoV-2 spike protein and the sequence alignment of listed coronaviruses around SARS-CoV-2 furin site and TMPRSS2 site. b MALDI-TOF analysis of GalNAcylation reactions catalyzed by purified GalNAc-Ts on the synthetic multibasic peptide of SARS-CoV-2 spike protein (674-693). Reactions were performed and analyzed as described in the Methods. An increase of 203 Da corresponds to the addition of one GalNAc residue. c ETD-MS2 spectrum of the O-GalNAcylated peptide from the GalNAc-T3 reaction. The mass of c- and z- fragment ions (e.g. the delta mass between c4 and c5) unambiguously assigned the GalNAc modification to T678. d MALDI-TOF analysis of GalNAcylation reactions catalyzed by purified GalNAc-Ts on T678-O-GalNAcylated peptide. An increase of 203 Da, corresponding to the modification with an additional GalNAc residue, was only observed with GalNAc-T7. e ETD-MS2 spectrum of the doubly O-GalNAcylated peptide from the GalNAc-T7 reaction. The mass of c- and z- fragment ions (e.g. the delta mass between c11 and c13) indicated the second GalNAc residue is located at S686. The GalNAc residues are denoted as yellow squares according to Consortium for Functional Glycomics (CFG) standard. Source data are provided as a Source Data file.
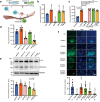
Fig. 2
Fig. 2. GalNAc-T3 and 7 inhibit furin processing of the spike protein by specific glycosylation at T678 and S686.
a A schematic diagram of the luciferase-based biosensor assay for furin cleavage. b Bioluminescence analysis of furin cleavage in HEK293T cells by biosensors containing the native S1/S2 boundary sequence or glycosite mutations. c Bioluminescence analysis of furin cleavage in HEK293T GALNT7 KO cells by biosensors containing the native S1/S2 boundary sequence or glycosite mutations. d Suppression of furin cleavage by GalNAc-T3 and T7 in the biosensor assay. HEK293T cells were co-transfected with the luciferase-based biosensor containing the native S1/S2 boundary sequence and GalNAc-Ts as indicated at the bottom. For (bd), Data are presented as mean values ± SD (n = 4 independent experiments). e Western blot and quantitative analysis of overexpressed spike protein in HEK293T WT and GALNTs KI cells. Total protein concentrations in cell lysates were measured by BCA assay and normalized for sample loading. GAPDH was used as a loading control. The results here are representative blots from three independent experiments. Quantitative analysis of Spike processing was performed by measuring the densitometry ratio between Cleaved-S and all forms of full-length S using Image J. Data are presented as mean values ± SD (n = 3 independent experiments). f GalNAc-T3 and 7 overexpression decreased syncytia formation in Vero E6 cells. Here shows representative views of spike protein-mediated syncytium formation in Vero E6 cells transfected with vector (NC), S-Native, S-R685A, S-Native/GALNT1, S-Native/GALNT3, S-Native/GALNT7 or S-Native/GALNT3/T7 plasmids. Cells were stained with DAPI (blue) and immuno-stained with anti-Flag antibody (green). Syncytia formation was quantified by the number of nuclei per syncytium (FITC+ cells containing multiple nuclei). The N values indicate the number of syncytium counted. Data are presented as mean ± SD. n = 5 independent experiments. Scale bar, 50 μm. For statistical comparisons between means in data (bf), two-tailed P values are calculated by unpaired Student’s t test. Unless otherwise labeled, the displayed P values are the significance between the experimental group and the control group (Native, Vehicle or HEK293T). NS: not significant. Source data are provided as a Source Data file.
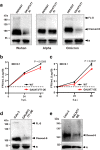
Fig. 3
Fig. 3. GalNAc-T3 and T7 inhibit furin-dependent assembly of the Virus Like Particles (VLPs).
a Western blot and quantitative analysis of the assembly and release of SARS-CoV-2 VLPs in HEK293T WT and GALNTs KI cells. Different HEK293T cells were co-transfected with native S, together with HA-tagged M, E and N. VLPs and cell lysates were pelleted and analyzed separately. b Western blot and quantitative analysis of the assembly of SARS-CoV-2 VLPs with native S protein and mutants in HEK293T WT. The S protein mutant lacking furin site (S-R665A) failed to be incorporated into VLPs. c Western blot and quantitative analysis of the assembly of SARS-CoV-2 VLPs with native S protein and T678A/S686A mutant S protein in HEK293T WT and GALNTs KI cells. For (a, b, c), results here are representative blots from three independent experiments. Quantitative analysis of S protein incorporation into VLP was performed by calculating the densitometry ratio of S protein (cleaved-S plus FL-S) to N protein, and then normalizing it against the ratio calculated for HEK293T WT (a, c) or native S (b). Data are presented as mean values ± SD (n = 3 independent experiments). For statistical comparisons between means, two-tailed P values are calculated by unpaired Student’s t test. Unless otherwise labeled, the displayed P values are the significance between the experimental group and the control group (HEK293T or S-Native). NS not significant. d The topology diagram of SARS-CoV-2 M protein. The N-terminal amino acid sequences of M proteins from SARS-CoV-2, SARS-CoV and MERS-CoV are aligned. The EE motif is highlighted by arrowheads. The diagram was generated by Protter. e Western blot analysis of the assembly of SARS-CoV-2 VLPs with native M protein and its EE motif mutant in HEK293T WT. f Co-immunoprecipitation of S protein with native M protein and its EE motif mutant. Co-immunoprecipitation was performed using anti-HA mAb and examined by western blotting analyses using anti-S1 mAb. IgG were used as a control. For (e) and (f), the results here are representative blots from three independent experiments. Source data are provided as a Source Data file.
Fig. 4
Fig. 4. Mutations near glycosylation sites affect the suppression of furin cleavage by GalNAc-T3 and T7.
a The sequence alignment of spike protein furin site from SARS-CoV-2 variants. b MALDI-TOF analysis of GalNAcylation reactions catalyzed by GalNAc-T3 and T7 on the synthetic multibasic substrate of SARS-CoV-2 spike protein (674-693) with P681H and P681H/N679K mutations. Reactions were performed and analyzed as in Fig. 1. c Western blot and quantitative analysis of the P681H and P681H/N679K spike protein processing in HEK293T WT and GALNTs KI cells. Plasmids encoding native, P681H or P681H/ N679K spike protein were transfected into HEK293T WT and GALNT3/T7 KI cells as indicated on top of the blot and spike proteins were detected with anti-S2 antibody. The results here are representative blots from three independent experiments. Quantitative analysis of Spike processing was performed by measuring the densitometry ratio between Cleaved-S and all forms of full-length S using Image J. Data are presented as mean values ± SD (n = 3 independent experiments). d Syncytium formation results of the P681H and P681H/N679K spike protein in Vero E6 cells. Vero E6 cells transfected with vector (NC), S-P681H, S-P681H/GALNT3/T7, S-P681H/N679K or, S-P681H/N679K/GALNT3/T7 plasmids were stained with DAPI (blue) and immuno-stained with anti-Flag antibody (green). The wild-type spike (S-Native) was included as a positive control. Syncytia formation was quantified by the number of nuclei per syncytium (FITC+ cells containing multiple nuclei). The N values indicate the number of syncytium counted. Data are presented as mean ± SD. n = 4 independent experiments. For statistical comparisons between means in data (c, d), two-tailed P values are calculated by unpaired Student’s t test. Unless otherwise labeled, the displayed P values are the significance between the experimental group and the control group (HEK293T or S-Native). NS: not significant. e Western blot analysis of the assembly of SARS-CoV-2 VLPs with P681H or P681H/N679K spike protein in HEK293T WT and GALNT3/T7 KI cells. VLPs with the native sequence of spike protein were produced in parallel as a control. The results here are representative blots from three independent experiments. Source data are provided as a Source Data file.
Fig. 5
Fig. 5. GalNAc-T3 and T7 inhibit replication of the omicron variant of SARS-CoV-2 in Calu-3 cells.
a Western blot analysis of the assembly of SARS-CoV-2 VLPs with alpha or omicron spike protein in HEK293T WT and GALNT3/T7 KI cells. VLPs were assembled and detected as in Fig. 3. VLPs with Wuhan spike protein were produced in parallel as a control. b Viral titers from Calu-3 cells infected with SARS-CoV-2 omicron variant (BA.1) at an MOI of 0.1, with or without co-expression of GalNAc-T3 and T7. c Viral titers from Calu-3 cells infected with SARS-CoV-2 omicron variant (BA.1) at an MOI of 0.1 with or without overexpression of GalNAc-T7. For (b, c) data are presented as mean values ± SEM (n = 3 biologically independent experiments), and two-tailed P values are calculated by unpaired Student’s t test and displayed above the compared means. d Western blot analysis of S protein and N protein of the omicron virions from Calu-3 cells 48 hours post infection (HPI), with or without co-expression of GalNAc-T3 and T7. e Western blot analysis of S protein and N protein of the omicron virions from Calu-3 cells 48 h post infection (HPI), with or without overexpression of GalNAc-T7. For data (a, d, e), the results here are representative blots from three independent experiments. Source data are provided as a Source Data file.
Fig. 6
Fig. 6. A proposed model for SARS-CoV-2 virion assembly.
The assembly of SARS-CoV-2 virion is facilitated by the charge-charge interactions between S1 and Membrane protein, which is mediated by furin cleavage of the spike protein (bottom schematic) and suppressed by O-glycosylation through GalNAc-T3 and T7 (top schematic). The structural models of SARS-CoV-2 Spike and Membrane protein in the schematics were generated using Pymol 2.5 (PDB code 7DDD and 7VGR, respectively). The Spike is shown in the cartoon representation with S1 colored in green and S2 colored in cyan. The residues encompassing the furin cleavage site in Spike are depicted as single-letter labeled circles with O-glycan modifications denoted according to CFG standards. The Membrane protein of SARS-CoV-2 is also shown in the cartoon representation and colored in brown with residues in the EE motif depicted as single-letter labeled circles. In the assembled virus particles, the Spike and Membrane protein are colored in green and orange, respectively.

Similar articles

Cited by

References

    1. Jaimes JA, Millet JK, Whittaker GR. Proteolytic cleavage of the SARS-CoV-2 spike protein and the role of the novel S1/S2 site. iScience. 2020;23:101212. doi: 10.1016/j.isci.2020.101212. - DOI - PMC - PubMed
    1. Hoffmann M, Kleine-Weber H, Pohlmann S. A multibasic cleavage site in the spike protein of SARS-CoV-2 is essential for infection of human lung cells. Mol. Cell. 2020;78:779–784.e775. doi: 10.1016/j.molcel.2020.04.022. - DOI - PMC - PubMed
    1. Wu Y, Zhao S. Furin cleavage sites naturally occur in coronaviruses. Stem Cell Res. 2020;50:102115. doi: 10.1016/j.scr.2020.102115. - DOI - PMC - PubMed
    1. Shang J, et al. Cell entry mechanisms of SARS-CoV-2. Proc. Natl. Acad. Sci. USA. 2020;117:11727–11734. doi: 10.1073/pnas.2003138117. - DOI - PMC - PubMed
    1. Bertram S, et al. Cleavage and activation of the severe acute respiratory syndrome coronavirus spike protein by human airway trypsin-like protease. J. Virol. 2011;85:13363–13372. doi: 10.1128/JVI.05300-11. - DOI - PMC - PubMed

MeSH terms

Substances

Supplementary concepts