Construction and analysis of pseudogene-related ceRNA network in breast cancer
- PMID: 38072995
- PMCID: PMC10711010
- DOI: 10.1038/s41598-023-49110-4
Construction and analysis of pseudogene-related ceRNA network in breast cancer
Abstract
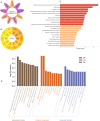
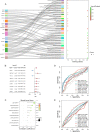
Breast cancer (BC) is one of the leading causes of cancer-related deaths in women. The present study explored the potential role of pseudogenes in BC via construction and analysis of a competing endogenous RNA (ceRNA) network through a three-step process. First, we screened differentially expressed genes in nine BC datasets. Then the gene-pseudogenes pairs (nine hub genes) were selected according to the functional enrichment and correlation analysis. Second, the candidate hub genes and interacting miRNAs were used to construct the ceRNA network. Further analysis of the ceRNA network revealed a crucial ceRNA module with two genes-pseudogene pairs and two miRNAs. The in-depth analysis identified the GBP1/hsa-miR-30d-5p/GBP1P1 axis as a potential tumorigenic axis in BC patients. In the third step, the GBP1/hsa-miR-30d-5p/GBP1P1 axis expression level was assessed in 40 tumor/normal BC patients and MCF-7 cell lines. The expression of GBP1 and GBP1P1 was significantly higher in the tumor compared to the normal tissue. However, the expression of hsa-miR-30d-5p was lower in tumor samples. Then, we introduced the GBP1P1 pseudogene into the MCF-7 cell line to evaluate its effect on GBP1 and hsa-miR-30d-5p expression. As expected, the GBP1 level increased while the hsa-miR-30d-5p level decreased in the GBP1P1-overexprsssing cell line. In addition, the oncogenic properties of MCF-7 (cell viability, clonogenicity, and migration) were improved after GBP1P1 overexpression. In conclusion, we report a ceRNA network that may provide new insight into the role of pseudogenes in BC development.
© 2023. The Author(s).
Conflict of interest statement
The authors declare no competing interests.
Figures


Similar articles
-
Construction of a lncRNA/pseudogene-hsa-miR-30d-5p-GJA1 regulatory network related to metastasis of pancreatic cancer.Genomics. 2021 Jul;113(4):1742-1753. doi: 10.1016/j.ygeno.2021.04.013. Epub 2021 Apr 9. Genomics. 2021. PMID: 33839271
-
Comprehensive analysis of a cuproptosis-related ceRNA network implicates a potential endocrine therapy resistance mechanism in ER-positive breast cancer.BMC Med Genomics. 2023 May 5;16(1):96. doi: 10.1186/s12920-023-01511-0. BMC Med Genomics. 2023. PMID: 37143115 Free PMC article.
-
A ceRNA network of BBOX1-AS1-hsa-miR-125b-5p/hsa-miR-125a-5p-CDKN2A shows prognostic value in cervical cancer.Taiwan J Obstet Gynecol. 2021 Mar;60(2):253-261. doi: 10.1016/j.tjog.2020.12.006. Taiwan J Obstet Gynecol. 2021. PMID: 33678324
-
Identification of a new pseudogenes/lncRNAs-hsa-miR-26b-5p-COL12A1 competing endogenous RNA network associated with prognosis of pancreatic cancer using bioinformatics analysis.Aging (Albany NY). 2020 Oct 7;12(19):19107-19128. doi: 10.18632/aging.103709. Epub 2020 Oct 7. Aging (Albany NY). 2020. PMID: 33027767 Free PMC article.
-
SNHG 12 and hsa-miR-140-5P may play an important role in the ceRNA network related to hypertrophic cardiomyopathy.J Thorac Dis. 2023 Mar 31;15(3):1353-1363. doi: 10.21037/jtd-23-189. Epub 2023 Mar 27. J Thorac Dis. 2023. PMID: 37065602 Free PMC article.
Cited by
-
Genomic Alterations Affecting Competitive Endogenous RNAs (ceRNAs) and Regulatory Networks (ceRNETs) with Clinical Implications in Triple-Negative Breast Cancer (TNBC).Int J Mol Sci. 2024 Feb 23;25(5):2624. doi: 10.3390/ijms25052624. Int J Mol Sci. 2024. PMID: 38473871 Free PMC article. Review.
References
MeSH terms
Substances
LinkOut - more resources
Full Text Sources
Medical
Research Materials


