iBet uBet web content aggregator. Adding the entire web to your favor.


Link to original content: http://pubmed.ncbi.nlm.nih.gov/37735176/
Lola-I is a promoter pioneer factor that establishes de novo Pol II pausing during development - PubMed Skip to main page content
U.S. flag

An official website of the United States government

Dot gov

The .gov means it’s official.
Federal government websites often end in .gov or .mil. Before sharing sensitive information, make sure you’re on a federal government site.

Https

The site is secure.
The https:// ensures that you are connecting to the official website and that any information you provide is encrypted and transmitted securely.

Access keys NCBI Homepage MyNCBI Homepage Main Content Main Navigation
. 2023 Sep 21;14(1):5862.
doi: 10.1038/s41467-023-41408-1.

Lola-I is a promoter pioneer factor that establishes de novo Pol II pausing during development

Affiliations

Lola-I is a promoter pioneer factor that establishes de novo Pol II pausing during development

Vivekanandan Ramalingam et al. Nat Commun. .

Abstract

While the accessibility of enhancers is dynamically regulated during development, promoters tend to be constitutively accessible and poised for activation by paused Pol II. By studying Lola-I, a Drosophila zinc finger transcription factor, we show here that the promoter state can also be subject to developmental regulation independently of gene activation. Lola-I is ubiquitously expressed at the end of embryogenesis and causes its target promoters to become accessible and acquire paused Pol II throughout the embryo. This promoter transition is required but not sufficient for tissue-specific target gene activation. Lola-I mediates this function by depleting promoter nucleosomes, similar to the action of pioneer factors at enhancers. These results uncover a level of regulation for promoters that is normally found at enhancers and reveal a mechanism for the de novo establishment of paused Pol II at promoters.


Conflict of interest statement

The authors declare no competing interests.

Figures

Fig. 1
Fig. 1. Lola-I is required for the loading of paused Pol II to target genes in the late Drosophila embryo.
a At promoters that have no Pol II occupancy in the early (2–4 h AEL) embryo but acquire paused Pol II in the late (14–17 h AEL) embryo (opening set), the Lola-I motif was identified de novo within 200 bp upstream of the TSS by MEME analysis (e-value = 8.1e−091). The Lola-I motif was enriched 6.6-fold in the opening set (n = 492) vs the constant set (n = 843) (*P = 8.75e−34, chi-squared test with multiple-testing correction). b A Western blot with antibodies specific for the Lola-I isoform shows that Lola-I increases in expression during embryogenesis. Tubulin is shown as control. Results shown are representative of at least comparable biological experiments and are consistent. Source data is provided as a Source Data file. c Single-gene example of the ChIP-seq data showing that Lola-I binding is found at the promoter of Tpi, a gene that acquires paused Pol II over time. d Heatmaps showing that the ~60% of Lola-I-bound regions found at promoters (n = 329) is associated with an increase in Pol II occupancy, RNA levels from the early (2–4 h AEL) to the late (14–17 h AEL) embryo, and DNAse hypersensitivity from the early (stage 5/3 h AEL) to the late (stage 14/11 h AEL) embryo. A random sample of 250 promoters from the constant set is used as control. The star denotes significance (*P < 2e−16) using a two-sided Wilcoxon test. e Mutant line lola-I ORC4 has a premature stop codon before the C2H2 zinc-finger region that codes for the DNA-binding domain. A Western blot confirms that lola-I ORC4 homozygous embryos produce a low amount of truncated Lola-I product (white arrow). The Rpb3 subunit of Pol II is shown as control below. The wt and lola /− lanes were not run adjacently in the original gel. Results shown are representative of at least two biological replicates and are consistent. Source data is provided as a Source Data file. f Pol II ChIP-seq signal at the Lola-I target gene Tpi is strongly reduced in homozygous lola ORC4 mutant embryos, while the control gene Dl remains unchanged. In the rescue line, which expresses lola-I cDNA in the lola-I ORC4 mutant background, Pol II occupancy is rescued. g Heatmap showing that the Pol II ChIP-seq signal and ATAC-seq accessibility is specifically reduced at the Lola-I target promoters in lola-I ORC4 mutant embryos. In the rescue line, Pol II occupancy and accessibility are rescued to levels comparable to wild-type. The star denotes significance (Pol II – wt-mutant: *P = 6.0e−15, mutant-rescue: *P = 2.3e−4; ATAC– wt-mutant: *P = 1.6e−10, mutant-rescue: *P = 2.8e−08) using a two-sided Wilcoxon test. RPM: normalized reads per million.
Fig. 2
Fig. 2. Lola-I establishes paused Pol II throughout the embryo.
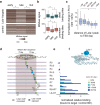
a Immunostaining using the Lola-I antibodies (yellow) shows that Lola-I is expressed ubiquitously in the late (14–17 h AEL) Drosophila embryo. As control, Lamin is shown (pink), which is also ubiquitous and nuclear. The brightness and contrast settings of the lookup table are linearly adjusted for clarity. The settings in the individual panels are the same as in the merge. scale bar: left - 100 µm and right - 10 µm. b ChIP-seq data shown as normalized reads per million (RPM) from isolated embryonic tissues of late-stage embryos (14–17 h AEL) using either Lola-I antibodies (turquoise) or Pol II antibodies (dark blue) reveal that Lola-I binding and paused Pol II are found in all examined tissues at Lola-I targets, even when the target gene is expressed only in a specific tissue (Gip is shown as example). Ubiquitous Pol II is not found for all genes, e.g., for the control gene Osi20, Pol II binding and expression is restricted to tracheal cells. The tissue-specific expression of Gip in crystal cells and Osi20 in tracheal cells are known from in situ hybridization shown below, courtesy of Berkeley Drosophila Genome Project,. c Average Pol II occupancy, Lola-I occupancy, and scRNA-seq levels across tissues confirm that Lola-I target genes show paused Pol II broadly across tissues but show tissue-specific gene expression, similar to the expression of previously described control genes that have restricted Pol II occupancy across tissues. The enrichment of the Pol II ChIP-seq signal was calculated for each promoter over input, and values of <2 fold were set to 0 (min). For each tissue, the values were then sorted from low to high and normalized to the highest value (max). These sorted values were then averaged across tissues for either the Lola-I targets or the control, showing that the values extend much broader across tissues for the Lola-I targets than for the control. The same procedure was used to depict the scRNA-seq expression values. The Lola-I binding signal was calculated in the same way, except that the values from all genes were normalized to the same maximum signal in order to show that the control genes have lower Lola-I binding.
Fig. 3
Fig. 3. Lola-I promotes tissue-specific gene expression through an effect on the promoter.
a Left panel: Boxplot of bulk RNA-seq data show that Lola-I targets are down-regulated in lola-I mutants compared to wild-type (14–17 h AEL), while control genes show overall similar expression levels. This confirms that Lola-I mediates its effect by directly binding to target promoters, and not by indirect effects that would affect all genes (Wilcoxon two-sided test, lolaORC4/ORC4: *P = 1.8e−11, lolaORC4/ORE50: *P < 2e−16). Right panel: Boxplot of bulk RNA-seq data show that genes associated with distal Lola-I binding sites are not significantly affected in lola-I mutants compared to wild-type (14–17 h AEL), while genes with Lola-I binding at the promoter (with or without distal binding) are reduced in expression, showing that Lola-I largely mediates its effect through binding promoters. b scRNA-seq analysis of wild-type and lola-I mutant embryos at 14–14.5 h AEL suggests that Lola-I is required for both tissue-specific expression (left) and basal expression levels in other tissues (right) at target genes (defined by >2-fold loss in Pol II occupancy in mutant embryos). Expression, shown as the fraction of cells with detectable expression, is reduced in lola-I mutant embryos compared to wild-type (Wilcoxon two-sided test, expressing tissue: *P = 1.1e−05, other tissue: *P = 0.00578). The same trend is observed for the median expression (Supplementary Fig. 3c). c scRNAseq expression data for the Lola-I target gene Gip is shown for each cell (red and gray dots) isolated from wild-type (left) or lola-I mutant embryos (right). A violin plot of the data is laid on top. In wild-type embryos, Gip is expressed at high levels in crystal cells (marked in red by the expression of the PPO2 gene), but also shows basal levels of expression in the majority of cells where Gip is not expected to be expressed. In lola-I embryos, both the specific expression and the basal expression are reduced. Box plots show the median as the central line, the first and the third quartiles as the box, and the upper and lower whiskers extend from the quartile box to the largest/smallest value within 1.5 times of the interquartile range.
Fig. 4
Fig. 4. Single-molecule FISH reveals that Lola-I lowers the gene activation barrier.
a Example of single-molecule FISH images of Gip (yellow), and PPO1 and PPO2 genes (pink) in wild-type embryos and lola-I −/− mutant embryos (DAPI - blue). Data were acquired with ×40 magnification, scale bar - 20 µm, with the same brightness and contrast settings. Top insets show the nascent Gip signal in the nuclei; bottom insets show the single Gip RNAs in the cytoplasm. The brightness and contrast in each inset was adjusted linearly for clarity. b The percentage of crystal cells (defined by high expression of PPO1 and PPO2) that express high levels of Gip is strongly reduced in lola-I mutant embryos compared to wild-type. Barplots show the mean, and the whiskers show the standard error of the mean, with the number of embryos (n): wild-type: 10–12 h n = 7, 12–14 h n = 8, 14–16 h n = 4, lola-I mutant: 10–12 h n = 7, 12–14 h n = 7, 14–16 h n = 7. Reduced Gip expression is observed for multiple time points showing that it is not due to a developmental delay and that Gip expression only mildly recovers over time. c The percentage of PPO1 and PPO2 positive crystal cells with a visible Gip nascent site of transcription (indicative of a transcriptional burst) is also strongly reduced in lola-I mutants (12–14 h AEL). The bar represents the mean, and the whiskers show the standard error of the mean (wild-type n = 7 and lola-I mutant n = 14, where n is the number of embryos). d Two-state model that was fitted to the data. e Histograms of mRNA/cell (dots), calculated from fluorescent intensities at ×100 magnification (see Methods), and fitted lines. The ratio of Koff and Kon was fixed to the ratio of crystal cells with visible nascent transcripts between wild-type and mutants as shown in (c).
Fig. 5
Fig. 5. Lola-I is a promoter pioneer factor.
a Heatmap of normalized MNase-seq data shows specific loss of nucleosome occupancy at the Lola-I target promoters during the late stages of Drosophila embryogenesis (Wilcoxon two-sided test, *P wt-early vs wt-late: 3.4e−9, wt-late vs mut-late 14–17 h: 3.4e−8). This does not occur in lola-I mutant embryos, as there is no statistically significant difference between wild-type early embryos and late lola-I mutant embryos. b Box plots of the MNase signal (centered on the Lola-I peaks) are shown for promoter-proximal regions and distal Lola-I-bound regions (Supplementary Data 2), which both show a significant decrease in late wild-type embryos (Wilcoxon two-sided test, *P distal, wt-early vs wt-late: *P = 4.5e−09, promoter wt-early vs wt-late: *P < 2e−16, distal wt-late vs mut-late: *P = 1.1e−08, promoter wt-late vs mut-late: *P = 4.1e−10). c Pol II recruitment, shown as change in normalized Pol II enrichment from the early to the late stage, only occurs when the Lola-I peak is found in close proximity to the TSS, showing that Lola-I depletes nucleosomes independently of Pol II recruitment (Wilcoxon two-sided test, *P = 1.2e−8). d Lola-I binds its motif preferentially at the edge of a nucleosome in vitro. Purified full-length Lola-I protein expressed in insect cells by baculovirus is incubated in vitro at different concentrations with nucleosomes reconstituted with Lola-I binding sites embedded in the 601 Widom sequence at different positions. e The relative binding of the Lola-I protein to the 601-templates containing the Lola-I motif vs the control 601-template without the motif is measured as the loss of signal in the nucleosomal band or the gain of signal in the super-shifted band (Supplementary Fig. 6) (relative to the no Lola-I lane - see methods). The results show that Lola-I binds most strongly when the motif is located along the nucleosomal edge. Significant cooperativity with additional motifs is not observed. f Illustration of the preferred position of the Lola-I motif with regard to the nucleosome structure. The nucleosome structure is from the RSCB protein data bank (5NL0). Box plots in the figure show the median (central line), the first and the third quartiles (box), and the largest/smallest value within 1.5 times of the interquartile range as whiskers.

Similar articles

Cited by

References

    1. Spitz F, Furlong EEM. Transcription factors: from enhancer binding to developmental control. Nat. Rev. Genet. 2012;13:613–626. doi: 10.1038/nrg3207. - DOI - PubMed
    1. Crawford GE, et al. Genome-wide mapping of DNase hypersensitive sites using massively parallel signature sequencing (MPSS) Genome Res. 2006;16:123–131. doi: 10.1101/gr.4074106. - DOI - PMC - PubMed
    1. Thurman RE, et al. The accessible chromatin landscape of the human genome. Nature. 2012;489:75–82. doi: 10.1038/nature11232. - DOI - PMC - PubMed
    1. Reddington JP, et al. Lineage-Resolved Enhancer and Promoter Usage during a Time Course of Embryogenesis. Dev. Cell. 2020;55:648–664.e9. doi: 10.1016/j.devcel.2020.10.009. - DOI - PubMed
    1. Andersson R, Sandelin A. Determinants of enhancer and promoter activities of regulatory elements. Nat. Rev. Genet. 2020;21:71–87. doi: 10.1038/s41576-019-0173-8. - DOI - PubMed

Publication types

LinkOut - more resources