iBet uBet web content aggregator. Adding the entire web to your favor.


Link to original content: http://pubmed.ncbi.nlm.nih.gov/37069376/
Structures of human primosome elongation complexes - PubMed Skip to main page content
U.S. flag

An official website of the United States government

Dot gov

The .gov means it’s official.
Federal government websites often end in .gov or .mil. Before sharing sensitive information, make sure you’re on a federal government site.

Https

The site is secure.
The https:// ensures that you are connecting to the official website and that any information you provide is encrypted and transmitted securely.

Access keys NCBI Homepage MyNCBI Homepage Main Content Main Navigation
. 2023 May;30(5):579-583.
doi: 10.1038/s41594-023-00971-3. Epub 2023 Apr 17.

Structures of human primosome elongation complexes

Affiliations

Structures of human primosome elongation complexes

Qixiang He et al. Nat Struct Mol Biol. 2023 May.

Abstract

The synthesis of RNA-DNA primer by primosome requires coordination between primase and DNA polymerase α subunits, which is accompanied by unknown architectural rearrangements of multiple domains. Using cryogenic electron microscopy, we solved a 3.6 Å human primosome structure caught at an early stage of RNA primer elongation with deoxynucleotides. The structure confirms a long-standing role of primase large subunit and reveals new insights into how primosome is limited to synthesizing short RNA-DNA primers.


Conflict of interest statement

Competing interests

The authors declare no competing interests.

Figures
Extended Data Fig. 1|
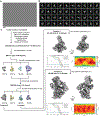
Extended Data Fig. 1|. Cryo-EM processing pipeline for the elongation complexes.
(a) Representative micrograph (n = 13,243) of the cryo-EM dataset. The scale bar dimension is 500 Å. (b) 2D classification averages of the elongation complexes. (c) Cryo-EM processing pipeline that was used to obtain the two cryo-EM maps of elongation complexes I and II.
Extended Data Fig. 2|
Extended Data Fig. 2|. Local resolution maps and map to model comparison of the cryo-EM reconstruction.
Local resolution maps of the (a) EC-I and (b) EC-II cryo-EM structures. (c) Representative cryo-EM densities encasing the corresponding atomic models of DNA template, RNA-DNA primer, p49, p58 and p180.
Extended Data Fig. 3|
Extended Data Fig. 3|. Structural comparison of template:primer bound to Polα catalytic core and to p58C between the two cryo-EM elongation complex models.
(a) The models of elongation complex I and II are aligned and the RMSD values of p58C, p180core, RNA-DNA primer, and DNA template are calculated. Their RMSD values are shown in the table in the panel. A ribbon model of the EC-II is shown with its subunits colored as per described in main text. The superimposed EC-I ribbon model is colored grey to illustrate the similarity between the two models. The ChimeraX software was used to perform the above RMSD analysis. (b) The crystal structure of p180core/template:primer (PDB code: 4QCL) was superimposed with p180core/template:primer part of primosome elongation complex II (RMSD = 1.10 Å2). (c) The crystal structure of template:primer/p58C (PDB code: 5F0Q) was superimposed with template:primer/p58C part of primosome elongation complex II (RMSD = 0.59 Å2).
Extended Data Fig. 4|
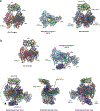
Extended Data Fig. 4|. Primosome undergoes a large conformation change as it progresses from the apo to elongation state.
The apo state of human primosome (PDB code: 5EXR) is compared with this work’s elongation states primosome, (a) EC-I and (b) EC-II. The four subunits of APO primosome are colored: p49 as green, p58 as dark grey, p70 as olive green, and p180 as salmon red. The elongation state primosomes are colored as described in Fig. 1. The APO and EC-I/II structures are aligned using the p180 subunit. Visual inspection of APO vs EC-II state shows the p49, p58, and p70 domains are rearranged relative to the p180core domain.
Extended Data Fig. 5|
Extended Data Fig. 5|. Mutagenesis analysis of platform-p180core interaction by primer extension assay using primosome with full-length Polα.
(a) SDS-PAGE analysis of tandem affinity purified full-length Primosome. 6xHis-tagged subunits (p49, p58, p70) were first enriched before pulling down the Twin-Strep-tagged p180 to obtain the assembled primosome complex. FT: flowthrough. The results are reproduced across multiple independent experiments (n > 3). (b) Mutations disrupting the platform-p180core interaction increase processivity of DNA synthesis. The mutant primosome (Polα/p49K95E/L96A/p58R235E), with full-length p180, is referred as 3 m in the panels. T1:P2 was used in all reactions. (c) Processivity quantification of the results from panel a using fraction of longer products (defined as >37nt products for -trap and >33nt products for +trap) over total product made. Triplicate data are represented as hollow circles while their mean and standard deviation (mean ± SD) are show as columns and error bars, respectively.
Extended Data Fig. 6|
Extended Data Fig. 6|. Detailed mutagenesis analysis of the platform-p180core interaction.
(a) Purified recombinant wild-type and mutant human primosomes. Mutant primosomes are annotated in gel as 1 m (ΔN-Polα/p49/p58R235E), 2 m (ΔN-Polα/p58/p49K95E/L96A), and 3 m (ΔN-Polα/p49K95E/L96A/p58R235E). This experiment was performed once. (b) Mutation(s) on either p49 or p58 has a similar effect as the combined mutation (3 m) on enzyme processivity. T1:P2 was used in all reactions without trap added. (c) Processivity quantification using fraction of longer products (>37nt) over total product from triplicates of panel b results. The triplicate data are represented as hollow circles while their mean and standard deviation (mean ± SD) are shown as columns and error bars.
Extended Data Fig. 7|
Extended Data Fig. 7|. DNA synthesis by primosome upon disruption of the interaction between p58C and template:primer.
As compared to the RNA-DNA primers made by wild-type primosome using template:primer with 5’-triphosphate (see Fig. 2d, lane 1), reactions using primosome with deleted p58C or the template:primer without the 5’-triphosphate resulted in longer products being made by the enzyme. Reactions corresponding to the left and right lanes contain T1:P2 and T1-P1, respectively. The results are reproducible across multiple independent experiments (n = 3).
Fig. 1|
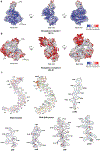
Fig. 1|. Architecture of human primosome elongation complexes.
a, Atomic model of EC-I that consists of polymerase α catalytic domain (p180core) co-binding to the template:primer substrate with primase large subunit C-terminal domain (p58C). Template (5′-ATAATGGTCGTGCCGCCAATAA-3′) is colored as hot pink, while the RNA–DNA primer (5′-pppGGCGGCACGAC/ddC/−3′) is colored as lawn green (RNA) and yellow (DNA). Underlined sequence indicates primer complementary region on the template. RNA portion of the primer is italicized. ddC, dideoxycytidine. b, Atomic model of EC-II, consisting of all four primosome subunits: p49, p58, p70 and p180. The p180core and p58C domains bind the template:primer substrate in the same way as EC-I (see a). The platform domain (p49–p58N–p70–p180CTD) is encircled by dashed lines. c,d, Zoomed-in views of primer–template interactions by the p180core and p58C domains in the EC-II structure: the p58C domain engaged the 5′ triphosphate group of the RNA primer and the 3′ tail of the DNA template (c); the RNA–DNA primer reaches into the p180 catalytic center and is poised to react with incoming dATP (d).
Fig. 2|
Fig. 2|. Platform domain interaction with p180core is important for timely termination of RNA–DNA primer synthesis.
a, Intermolecular interactions enabling docking of p180core to the platform. Overall view is shown on the left. b,c, Close-up views of intersubunit interactions in the two interaction areas are shown on the right. The side chains of residues selected for mutations are shown and colored by heteroatom. d, Mutations disrupting the platform–p180core interaction increased processivity of DNA synthesis. The mutant primosome (ΔN-Polα/p49K95E/L96A/p58R235E) is termed 3 m. T1:P2 was used in all reactions. T1 and P2 sequences are provided in Supplementary Table 1. e, Processivity quantification of the results from d using fraction of longer products (defined as >37 nt products for lanes without trap and >33 nt products for lanes with trap added) over total products made. Independent data points (three independent experiments) are shown as hollow circles, while their mean ± standard deviation is drawn as columns and error bars, respectively.

Similar articles

Cited by

References

    1. Baranovskiy AG & Tahirov TH Elaborated action of the human primosome. Genes 8, 62 (2017). - PMC - PubMed
    1. Pellegrini L The Pol alpha-primase complex. Subcell. Biochem 62, 157–169 (2012). - PubMed
    1. Lim C & Cech TR Shaping human telomeres: from shelterin and CST complexes to telomeric chromatin organization. Nat. Rev. Mol. Cell Biol. 22, 283–298 (2021). - PMC - PubMed
    1. Fan X & Price CM Coordinate regulation of G- and C strand length during new telomere synthesis. Mol. Biol. Cell 8, 2145–2155 (1997). - PMC - PubMed
    1. Reveal PM, Henkels KM & Turchi JJ Synthesis of the mammalian telomere lagging strand in vitro. J. Biol. Chem. 272, 11678–11681 (1997). - PubMed

Publication types