Responses in fast-spiking interneuron firing rates to parameter variations associated with degradation of perineuronal nets
- PMID: 37058180
- PMCID: PMC10182141
- DOI: 10.1007/s10827-023-00849-9
Responses in fast-spiking interneuron firing rates to parameter variations associated with degradation of perineuronal nets
Abstract
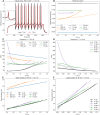
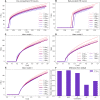
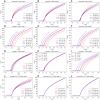
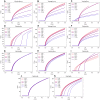
The perineuronal nets (PNNs) are sugar coated protein structures that encapsulate certain neurons in the brain, such as parvalbumin positive (PV) inhibitory neurons. As PNNs are theorized to act as a barrier to ion transport, they may effectively increase the membrane charge-separation distance, thereby affecting the membrane capacitance. Tewari et al. (2018) found that degradation of PNNs induced a 25%-50% increase in membrane capacitance [Formula: see text] and a reduction in the firing rates of PV-cells. In the current work, we explore how changes in [Formula: see text] affects the firing rate in a selection of computational neuron models, ranging in complexity from a single compartment Hodgkin-Huxley model to morphologically detailed PV-neuron models. In all models, an increased [Formula: see text] lead to reduced firing, but the experimentally reported increase in [Formula: see text] was not alone sufficient to explain the experimentally reported reduction in firing rate. We therefore hypothesized that PNN degradation in the experiments affected not only [Formula: see text], but also ionic reversal potentials and ion channel conductances. In simulations, we explored how various model parameters affected the firing rate of the model neurons, and identified which parameter variations in addition to [Formula: see text] that are most likely candidates for explaining the experimentally reported reduction in firing rate.
Keywords: Capacitance; Fast-spiking interneurons; Firing rate; Multicompartment models of neurons; PV cells; Perineuronal nets.
© 2023. The Author(s).
Conflict of interest statement
The authors have no competing interests to declare.
Figures


Similar articles
-
Perineuronal nets decrease membrane capacitance of peritumoral fast spiking interneurons in a model of epilepsy.Nat Commun. 2018 Nov 9;9(1):4724. doi: 10.1038/s41467-018-07113-0. Nat Commun. 2018. PMID: 30413686 Free PMC article.
-
Fast-Spiking Interneurons Exposed in Tumor-Associated Epilepsy.Epilepsy Curr. 2019 Mar-Apr;19(2):119-121. doi: 10.1177/1535759719835351. Epilepsy Curr. 2019. PMID: 30955416 Free PMC article.
-
Cocaine Exposure Modulates Perineuronal Nets and Synaptic Excitability of Fast-Spiking Interneurons in the Medial Prefrontal Cortex.eNeuro. 2018 Oct 4;5(5):ENEURO.0221-18.2018. doi: 10.1523/ENEURO.0221-18.2018. eCollection 2018 Sep-Oct. eNeuro. 2018. PMID: 30294670 Free PMC article.
-
Perineuronal Nets and Metal Cation Concentrations in the Microenvironments of Fast-Spiking, Parvalbumin-Expressing GABAergic Interneurons: Relevance to Neurodevelopment and Neurodevelopmental Disorders.Biomolecules. 2021 Aug 18;11(8):1235. doi: 10.3390/biom11081235. Biomolecules. 2021. PMID: 34439901 Free PMC article. Review.
-
Perineuronal nets as regulators of parvalbumin interneuron function: Factors implicated in their formation and degradation.Basic Clin Pharmacol Toxicol. 2024 May;134(5):614-628. doi: 10.1111/bcpt.13994. Epub 2024 Mar 1. Basic Clin Pharmacol Toxicol. 2024. PMID: 38426366 Review.
Cited by
-
Perineuronal Nets in the Rat Medial Prefrontal Cortex Alter Hippocampal-Prefrontal Oscillations and Reshape Cocaine Self-Administration Memories.J Neurosci. 2024 Aug 21;44(34):e0468242024. doi: 10.1523/JNEUROSCI.0468-24.2024. J Neurosci. 2024. PMID: 38991791
-
Increased expression of chondroitin sulfate proteoglycans in dentate gyrus and amygdala causes postinfectious seizures.Brain. 2024 May 3;147(5):1856-1870. doi: 10.1093/brain/awad430. Brain. 2024. PMID: 38146224
-
Infection-induced epilepsy is caused by increased expression of chondroitin sulfate proteoglycans in hippocampus and amygdala.bioRxiv [Preprint]. 2023 May 17:2023.05.16.541066. doi: 10.1101/2023.05.16.541066. bioRxiv. 2023. Update in: Brain. 2024 May 3;147(5):1856-1870. doi: 10.1093/brain/awad430. PMID: 37292901 Free PMC article. Updated. Preprint.
References
-
- Abbott, L. F., & Kepler, T. B. (1990). Model neurons: from Hodgkin-Huxley to Hopfield. In Statistical mechanics of neural networks (Springer). 5–18
-
- Allen Institute for Brain Science. (2017). Technical White Paper: Biophysical Modeling - Perisomatic. http://help.brain-map.org/display/celltypes/Documentation
-
- Allen Institute for Brain Science. (2022). Overview: Allen brain atlas: Cell types. http://celltypes.brain-map.org/
-
- Bartos, M. & Elgueta, C. (2012). Functional characteristics of parvalbumin- and cholecystokinin-expressing basket cells. The Journal of Physiology590, 669–681. https://onlinelibrary.wiley.com/doi/pdf/10.1113/jphysiol.2011.226175 - DOI - PMC - PubMed
Publication types
MeSH terms
LinkOut - more resources
Full Text Sources
Research Materials


