iBet uBet web content aggregator. Adding the entire web to your favor.


Link to original content: http://pubmed.ncbi.nlm.nih.gov/36639202/
A chromosome-scale epigenetic map of the Hydra genome reveals conserved regulators of cell state - PubMed Skip to main page content
U.S. flag

An official website of the United States government

Dot gov

The .gov means it’s official.
Federal government websites often end in .gov or .mil. Before sharing sensitive information, make sure you’re on a federal government site.

Https

The site is secure.
The https:// ensures that you are connecting to the official website and that any information you provide is encrypted and transmitted securely.

Access keys NCBI Homepage MyNCBI Homepage Main Content Main Navigation
. 2023 Feb;33(2):283-298.
doi: 10.1101/gr.277040.122. Epub 2023 Jan 13.

A chromosome-scale epigenetic map of the Hydra genome reveals conserved regulators of cell state

Affiliations

A chromosome-scale epigenetic map of the Hydra genome reveals conserved regulators of cell state

Jack F Cazet et al. Genome Res. 2023 Feb.

Abstract

The epithelial and interstitial stem cells of the freshwater polyp Hydra are the best-characterized stem cell systems in any cnidarian, providing valuable insight into cell type evolution and the origin of stemness in animals. However, little is known about the transcriptional regulatory mechanisms that determine how these stem cells are maintained and how they give rise to their diverse differentiated progeny. To address such questions, a thorough understanding of transcriptional regulation in Hydra is needed. To this end, we generated extensive new resources for characterizing transcriptional regulation in Hydra, including new genome assemblies for Hydra oligactis and the AEP strain of Hydra vulgaris, an updated whole-animal single-cell RNA-seq atlas, and genome-wide maps of chromatin interactions, chromatin accessibility, sequence conservation, and histone modifications. These data revealed the existence of large kilobase-scale chromatin interaction domains in the Hydra genome that contain transcriptionally coregulated genes. We also uncovered the transcriptomic profiles of two previously molecularly uncharacterized cell types: isorhiza-type nematocytes and somatic gonad ectoderm. Finally, we identified novel candidate regulators of cell type-specific transcription, several of which have likely been conserved at least since the divergence of Hydra and the jellyfish Clytia hemisphaerica more than 400 million years ago.


Figures

Figure 1.
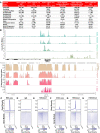
Figure 1.
New genome assemblies provide improved resources for Hydra molecular biology research. (A) The Hydra vulgaris strain AEP and Hydra oligactis genome assemblies presented in this study are marked improvements on the previously available reference genomes for their respective species. (B) Representative plot of CUT&Tag, ATAC-seq, and genomic conservation tracks centered on the hybra1 gene (Technau and Bode 1999). For the sequencing data, each track represents the signal from pooled biological replicates for the specified library type. A plot of the same locus that includes separate tracks for each CUT&Tag and ATAC-seq biological replicate is presented in Supplemental Figure S4. (CH) Read distribution for sequencing data centered on AEP assembly gene models. (C) Whole-animal RNA-seq data are strongly enriched in predicted coding sequences. (D) Control IgG CUT&Tag reads show minimal enrichment in or around genes. (E) H3K4me1 is enriched in promoter-proximal regions, but only weakly enriched at transcription start site (TSS). (F) ATAC-seq is enriched at TSS, but also shows some enrichment in more distal regions, likely because ATAC-seq targets both promoters and enhancers. (G) H3K4me3 is strongly enriched at the TSS. (H) H3K27me3 shows minimal or no enrichment near transcribed genes. (TTS) Transcription termination site.
Figure 2.
Figure 2.
Phylogenetic footprinting reveals conserved regulatory elements and transcription factor (TF) binding sites across the Hydra genome. (A) Quantification of TF binding motif conservation across four Hydra genomes. A positive log odds value indicates the nonshuffled motif had a higher conservation rate than its shuffled control. Statistical significance was evaluated using a chi-square test with an FDR cutoff of 0.01. (B) The distribution of sequence conservation levels around genes suggests that a sizable minority of promoter-proximal CREs extends farther than 2 kb from the nearest TSS. The conservation score represents the average number of non-AEP hydrozoan genomes that had the same base as the AEP assembly at a given locus. (AUC) Area under the curve; (TSS) transcription start site; (TTS) transcription termination site. Gene bodies were excluded from the AUC calculation. (C,D) Distribution plots summarizing the distance from the furthest upstream CRE for each gene to the predicted target TSS based on either ATAC-seq (C) or H3K4me1 CUT&Tag (D). Dotted vertical lines demarcate 2 kb from the TSS.
Figure 3.
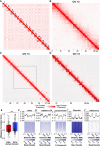
Figure 3.
Hi-C data reveal hierarchical chromatin architecture in the Hydra genome. (A) Hi-C contact map for the H. vulgaris strain AEP assembly reveals 15 pseudochromosomes with high levels of both inter-chromosomal interactions between presumptive centromeric regions and intra-chromosomal interactions between centromeric and telomeric regions. (B) The chromatin interaction map for Chromosome 13 reveals megabase-scale chromatin compartments. The black dotted lines indicate the region visualized in the subsequent figure panel. (C) Kilobase-scale interaction domains can be found within a single megabase-scale compartment. (D) Representative depiction of predicted kilobase-scale chromatin interaction domains in Hydra (black lines). (E) Boxplot/scatterplot depicting the correlation in expression for adjacent gene pairs show that gene pairs within the same domain (intra-domain pairs) were significantly more similar than pairs that spanned a domain boundary (inter-domain pairs; Welch two-sample t-test P-value = 6.93 × 10⁻⁵). (FJ) Predicted domain boundaries fall within regions of heterochromatin. Domain boundaries are associated with reduced chromatin accessibility (F), H3K4me1 (G), and sequence conservation (H) and with elevated repeat element density (I) and H3K27me3 (J).
Figure 4.
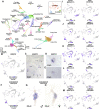
Figure 4.
An updated Hydra single-cell RNA-seq atlas reveals novel regulators of gene coexpression in Hydra. (A) Uniform manifold approximation and projection (UMAP) dimensional reduction of the Hydra single-cell RNA-seq atlas mapped to the AEP reference genome captures virtually all known cell states in adult polyps. Inset shows UMAP colored by the three stem cell lineages in adult Hydra. (NCs) Nematocytes; (NBs) nematoblasts; (SCs) stem cells; (Ecto) ectodermal epithelial cells; (Endo) endodermal epithelial cells; (GCs) gland cells; (Ec) neuron subtypes found in the ectoderm; (En) neuron subtypes found in the endoderm. (B) The gene G008733 is a specific marker for isorhiza nematocytes. (CE) In situ hybridization targeting G008733 labels isorhiza nematocytes (black arrowheads) in upper body column tissue. (F) scleraxis is a specific marker for ectodermal somatic gonad cells. (G) In situ hybridization targeting scleraxis in male polyps labels ectodermal testes cells. (H) In situ hybridization reveals scleraxis is expressed in egg patches in female polyps. (IM) Motif enrichment and gene expression patterns reveal candidate regulators of cell state. (I) TCF motif enrichment and wnt3 expression data corroborate the role of TCF/Wnt signaling in epithelial head tissue. (J) GATA motif enrichment and expression data corroborate the role of gata1-3 in aboral epithelial tissue and suggest an additional function in Ec3 neurons. (K) Pou4 motif enrichment and expression data suggest pou4 regulates transcription in differentiating and mature neurons and nematocytes. (L) Ebf motif enrichment and expression data suggest ebf regulates transcription during oogenesis. (M) NR2F motif enrichment and expression data suggest nr2f-like regulates transcription during nematogenesis. Corresponding JASPAR motif IDs are provided in the parenthetical text under the motif names (Fornes et al. 2020). (ES) Enrichment score; (NC) normalized counts.
Figure 5.
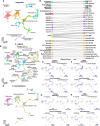
Figure 5.
Aligned Hydra and Clytia single-cell atlases reveal conserved cell type–specific transcriptional regulation. (AC) UMAP dimensional reduction of aligned Hydra and Clytia medusa single-cell atlases clusters together equivalent cell types from the two species. (D) Sankey plot showing transcriptional similarities between Hydra (right column) and Clytia (left column) cell types highlights extensive similarities among interstitial cell types. The alignment score quantifies the proportion of mutual nearest neighbors for one cell type that are made up of members of another cell type. An alignment score threshold of 0.05 was used to exclude poorly aligned cell types. (NCs) Nematocytes; (NBs) nematoblasts; (SCs) stem cells; (Ecto) ectodermal epithelial cells; (Endo) endodermal epithelial cells; (GCs) gland cells; (Ec) neuron subtypes found in the ectoderm; (En) neuron subtypes found in the endoderm; (Tent.) tentacles; (GD) gastroderm. (EH) Conserved motif enrichment and gene expression patterns reflect gene regulatory network conservation in hydrozoans. (E) pou4 is a conserved regulator of late stage and mature neurons and nematocytes. (F) paxA is a conserved regulator of nematoblasts. (G) foxn1/4 is a conserved regulator of nematocyte maturation. (H) ebf is a conserved regulator of oogenesis. (ES) Enrichment score; (NC) normalized counts.

Similar articles

Cited by

References

    1. Arendt D. 2008. The evolution of cell types in animals: emerging principles from molecular studies. Nat Rev Genet 9: 868–882. 10.1038/nrg2416 - DOI - PubMed
    1. Armstrong J, Hickey G, Diekhans M, Fiddes IT, Novak AM, Deran A, Fang Q, Xie D, Feng S, Stiller J, et al. 2020. Progressive Cactus is a multiple-genome aligner for the thousand-genome era. Nature 587: 246–251. 10.1038/s41586-020-2871-y - DOI - PMC - PubMed
    1. Babonis LS, Martindale MQ. 2017a. PaxA, but not PaxC, is required for cnidocyte development in the sea anemone Nematostella vectensis. Evodevo 8: 14. 10.1186/s13227-017-0077-7 - DOI - PMC - PubMed
    1. Babonis LS, Martindale MQ. 2017b. Phylogenetic evidence for the modular evolution of metazoan signalling pathways. Philos Trans R Soc Lond B Biol Sci 372: 20150477. 10.1098/rstb.2015.0477 - DOI - PMC - PubMed
    1. Bode HR, Heimfeld S, Chow MA, Huang LW. 1987. Gland cells arise by differentiation from interstitial cells in Hydra attenuata. Dev Biol 122: 577–585. 10.1016/0012-1606(87)90321-6 - DOI - PubMed

Publication types

LinkOut - more resources