iBet uBet web content aggregator. Adding the entire web to your favor.


Link to original content: http://pubmed.ncbi.nlm.nih.gov/36430539/
A Novel Antithrombocytopenia Agent, Rhizoma cibotii, Promotes Megakaryopoiesis and Thrombopoiesis through the PI3K/AKT, MEK/ERK, and JAK2/STAT3 Signaling Pathways - PubMed Skip to main page content
U.S. flag

An official website of the United States government

Dot gov

The .gov means it’s official.
Federal government websites often end in .gov or .mil. Before sharing sensitive information, make sure you’re on a federal government site.

Https

The site is secure.
The https:// ensures that you are connecting to the official website and that any information you provide is encrypted and transmitted securely.

Access keys NCBI Homepage MyNCBI Homepage Main Content Main Navigation
. 2022 Nov 14;23(22):14060.
doi: 10.3390/ijms232214060.

A Novel Antithrombocytopenia Agent, Rhizoma cibotii, Promotes Megakaryopoiesis and Thrombopoiesis through the PI3K/AKT, MEK/ERK, and JAK2/STAT3 Signaling Pathways

Affiliations

A Novel Antithrombocytopenia Agent, Rhizoma cibotii, Promotes Megakaryopoiesis and Thrombopoiesis through the PI3K/AKT, MEK/ERK, and JAK2/STAT3 Signaling Pathways

Wang Chen et al. Int J Mol Sci. .

Abstract

Background: Cibotii rhizoma (CR) is a famous traditional Chinese medicine (TCM) used to treat bleeding, rheumatism, lumbago, etc. However, its therapeutic effects and mechanism against thrombocytopenia are still unknown so far. In the study, we investigated the effects of aqueous extracts of Cibotii rhizoma (AECRs) against thrombocytopenia and its molecular mechanism.

Methods: Giemsa staining, phalloidin staining, and flow cytometry were performed to measure the effect of AECRs on the megakaryocyte differentiation in K562 and Meg-01 cells. A radiation-induced thrombocytopenia mouse model was constructed to assess the therapeutic actions of AECRs on thrombocytopenia. Network pharmacology and experimental verification were carried out to clarify its mechanism against thrombocytopenia.

Results: AECRs promoted megakaryocyte differentiation in K562 and Meg-01 cells and accelerated platelet recovery and megakaryopoiesis with no systemic toxicity in radiation-induced thrombocytopenia mice. The PI3K/AKT, MEK/ERK, and JAK2/STAT3 signaling pathways contributed to AECR-induced megakaryocyte differentiation. The suppression of the above signaling pathways by their inhibitors blocked AERC-induced megakaryocyte differentiation.

Conclusions: AECRs can promote megakaryopoiesis and thrombopoiesis through activating PI3K/AKT, MEK/ERK, and JAK2/STAT3 signaling pathways, which has the potential to treat radiation-induced thrombocytopenia in the clinic.

Keywords: Cibotii rhizoma; JAK2/STAT3; MEK/ERK; PI3K/AKT; megakaryocyte differentiation; network pharmacology; thrombocytopenia.


Conflict of interest statement

The authors declare that they have no conflicts of interest with the contents of this article.

Figures
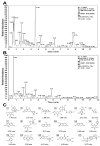
Figure 1
Figure 1
(A,B) The total ion current chromatogram of aqueous extracts of Cibotii rhizoma (AECRs): the positive mode (A); the negative mode (B). (C) Chemical structure of 17 compounds in AECRs.
Figure 2
Figure 2
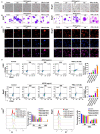
Determination of K562 and Meg01 cell concentrations. (A) Measurement of cell proliferation of K562 and Meg01 cells with the CCK-8 assay after AECR intervention. The values represent the means ± standard deviations (n = 3). (B) LDH assay for K562 and Meg01 cell cytotoxicity. Groups were set as follows: the control group, the AECR (200, 300, 400 μg/mL) group, and the max group (sample maximum activity control group). Additionally, 2, 4, and 6 represent the number of consecutive days of AECR intervention. The values represent the means ± standard deviations (n = 3). (C) After Annexin V-FITC/PI staining for K562 and Meg01 cells, the apoptosis was detected. The values represent the means ± standard deviations (n = 3). * p < 0.05, ** p < 0.01, *** p < 0.001 versus the control group. AECRs: aqueous extracts of Cibotii rhizoma; LDH: lactate dehydrogenase.
Figure 3
Figure 3
AECRs induce K562 and Meg01 cell differentiation and maturation. (A) Representative images show that cell size is increased after 4 days of AECR and PMA intervention (red arrowheads). (B) Cells stained with Giemsa showed large and numerous nuclei upon PMA or AECR treatment for 4 days (red arrowheads). (C) Cells stained with phalloidin showed the enhanced expression of F-actin upon PMA or AECR treatment for 4 days. (D) The CD41 and CD42b expression levels were analyzed by flow cytometry after 4 days of treatment with AECRs and PMA. On the right, this statistical histogram displays CD41+ CD42b+ cell proportions. The values represent the means ± standard deviations (n = 3). (E) After the cells were treated with AECRs for 4 days, the cells with PI staining were used to analyze DNA content (2, 4, and >4N) by flow cytometry. On the right, this statistical histogram displays cell proportions. The values represent the means ± standard deviations (n = 3). *** p < 0.001 versus the control group. AECRs: aqueous extracts of Cibotii rhizoma; PMA: phorbol-12-myristate-13-acetate.
Figure 4
Figure 4
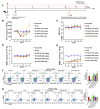
AECRs accelerate the recovery of peripheral blood PLTs in mice with thrombocytopenia. (A) Schematic diagram of animal experiment. (BE) AECRs affect the PLTs, MPV, RBCs, and WBCs in peripheral blood. The values represent the means ± standard deviations (n = 8). * p < 0.05, ** p < 0.01, *** p < 0.001 versus the model group. (F,G) The CD41+ CD61+ and CD41+ CD62P+ content on platelets were analyzed by flow cytometry on day 10 after treatment with AECRs. On the right, these statistical histograms show the proportion of CD41+ CD61+ and CD41+ CD62P+ PLTs in each group. The values represent the means ± standard deviations (n = 3). * p < 0.05, ** p < 0.01, *** p < 0.001, **** p < 0.0001 versus model group. AECRs: aqueous extracts of Cibotii Rhizoma; PLTs: platelets; MPV: mean platelet volume; WBCs: white blood cells; RBCs: red blood cells.
Figure 5
Figure 5
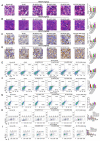
AECRs promoted the differentiation and maturation of BM and splenic megakaryocytes at 10 days. (A,B) H&E staining shows that the megakaryocytes from BM and the spleen were increased after AECR (143 mg/kg, 286 mg/kg, and 429 mg/kg) and TPO treatment (blue arrowheads). On the right, this statistical histogram shows cell proportions in each group. The values represent the means ± standard deviations (n = 3). (C,D) Immunohistochemical staining shows that the number of CD41-positive (Figure 5C) and VWF-positive (Figure 5D) megakaryocytes are increased after AECR (143 mg/kg, 286 mg/kg, and 429 mg/kg) and TPO treatment (blue arrowheads). On the right, this statistical histogram shows cell proportions in each group. The values represent the means ± standard deviations (n = 3). (EG) Flow cytometry analysis of c-Kit+ CD41+, CD41+ CD61+, and CD41+ CD62P+ expressions on BM treated with AECRs (143 mg/kg, 286 mg/kg, and 429 mg/kg) and TPO. On the right, these statistical histograms show the ratio of c-Kit+ CD41+, CD41+ CD61+, and CD41+ CD62P+ cells in each group. The values represent the means ± standard deviations (n = 3). (H) BM cells were stained with CD41+ and PI, and DNA content (2, 4, 8, 16, and >16N) was determined by flow cytometry. On the right, this statistical histogram shows the ratio of cells in each group. The values represent the means ± standard deviations (n = 3). (I) The spleen cells were stained with CD41+ and PI, and flow cytometry was used to calculate DNA content (2, 4, 8, and >8 N). On the right, this statistical histogram shows cell proportions in each group. The values represent the means ± standard deviations (n = 3). * p < 0.05, ** p < 0.01, *** p < 0.001 vs. model group. AECRs: aqueous extracts of Cibotii rhizoma; BM: bone marrow; TPO: thrombopoietin.
Figure 6
Figure 6
Network pharmacological prediction. (A) The Venn diagram of AECR targets and thrombocytopenia targets. Blue: AECR targets. Red: thrombocytopenia targets. Pink: common targets. (B) The AECR–ingredient–target–thrombocytopenia network. (C) The PPI network shows the targets of AECRs against thrombocytopenia with a combined score of >0.7, a degree of ≥23, a BC of ≥0.004028, and a CC of ≥0.443925. (D) GO enrichment analysis (p < 0.01). (E) Bubble plot of 11 KEGG pathways of AECRs in the treatment of thrombocytopenia. Greater enrichment is reflected in a larger fold enrichment. The size of the bubble represents the number of enriched genes in each pathway. The color of the bubble represents the Log10 range (p-value). (F) The AECR–ingredient–target–thrombocytopenia pathway network. “**” stands for p < 0.01. AECRs: aqueous extracts of Cibotii rhizoma.
Figure 7
Figure 7
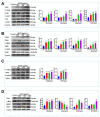
After incubating K562 cells with AECRs (200, 300, and 400 μg/mL) for 4 days, the expression of these proteins were determined by Western blot. These proteins were (A) IRS1, PI3K, AKT, and mTOR; (B) ESR1, RAS, MEK, and ERK; (C) JAK2 and STAT3; (D) TAL1, c-Myb, MEIS1, and and PBX1. On the right, this statistical histogram represents the protein level in each group. The values represent the means ± standard deviations (n = 3). * p < 0.05, ** p < 0.01, *** p < 0.001 versus the control group. AECRs: aqueous extracts of Cibotii rhizoma.
Figure 8
Figure 8
Flow cytometry was used to detect the content of CD41 and CD42b after K562 cells were incubated with inhibitors or AECRs for 4 days. The groups were set as follows: the control group, the AECR (400 μg/mL) group, the inhibitor group, and the inhibitor + AECR (400 μg/mL) group. These inhibitors were (A) LY294002, (B) ruxolitinib phosphate, and (C) SCH772984. On the right, this statistical histogram depicts the CD41+ CD42b+ cell proportion in each group. The values represent the means ± standard deviations (n = 3). *** p < 0.001 versus the control group. AECRs: aqueous extracts of Cibotii rhizoma.
Figure 9
Figure 9
Rhizoma cibotii (RC) promotes megakaryopoiesis and thrombopoiesis through PI3K/AKT, MEK/ERK, and JAK2/STAT3 signaling pathways.

Similar articles

Cited by

References

    1. Praveen Kumar M.K., Shyama S.K., Sonaye B.S., Naik U.R., Kadam S.B., Bipin P.D., D’Costa A., Chaubey R.C. Evaluation of γ-radiation-induced DNA damage in two species of bivalves and their relative sensitivity using comet assay. Aquat. Toxicol. 2014;150:1–8. doi: 10.1016/j.aquatox.2014.02.007. - DOI - PubMed
    1. Khan S., Adhikari J.S., Rizvi M.A., Chaudhury N.K. Melatonin attenuates 60Co γ-ray-induced hematopoietic, immunological and gastrointestinal injuries in C57BL/6 male mice. Environ. Toxicol. 2017;32:501–518. doi: 10.1002/tox.22254. - DOI - PubMed
    1. Till J.E., McCulloch E.A. Repair processes in irradiated mouse hematopoietic tissue. Ann. N. Y. Acad. Sci. 1964;114:115–125. doi: 10.1111/j.1749-6632.1964.tb53566.x. - DOI - PubMed
    1. Kiang J.G., Olabisi A.O. Radiation: A poly-traumatic hit leading to multi-organ injury. Cell Biosci. 2019;9:25. doi: 10.1186/s13578-019-0286-y. - DOI - PMC - PubMed
    1. Satyamitra M.M., Cassatt D.R., Taliaferro L.P. Meeting Commentary: A Poly-Pharmacy Approach to Mitigate Acute Radiation Syndrome (ARS) Radiat. Res. 2021;196:423–428. doi: 10.1667/RADE-21-00053.1. - DOI - PMC - PubMed

Substances

LinkOut - more resources