iBet uBet web content aggregator. Adding the entire web to your favor.


Link to original content: http://pubmed.ncbi.nlm.nih.gov/35064921/
Allosteric modulation of dopamine D2L receptor in complex with Gi1 and Gi2 proteins: the effect of subtle structural and stereochemical ligand modifications - PubMed Skip to main page content
U.S. flag

An official website of the United States government

Dot gov

The .gov means it’s official.
Federal government websites often end in .gov or .mil. Before sharing sensitive information, make sure you’re on a federal government site.

Https

The site is secure.
The https:// ensures that you are connecting to the official website and that any information you provide is encrypted and transmitted securely.

Access keys NCBI Homepage MyNCBI Homepage Main Content Main Navigation
. 2022 Apr;74(2):406-424.
doi: 10.1007/s43440-021-00352-x. Epub 2022 Jan 22.

Allosteric modulation of dopamine D2L receptor in complex with Gi1 and Gi2 proteins: the effect of subtle structural and stereochemical ligand modifications

Affiliations

Allosteric modulation of dopamine D2L receptor in complex with Gi1 and Gi2 proteins: the effect of subtle structural and stereochemical ligand modifications

Justyna Żuk et al. Pharmacol Rep. 2022 Apr.

Abstract

Background: Allosteric modulation of G protein-coupled receptors (GPCRs) is nowadays one of the hot topics in drug discovery. In particular, allosteric modulators of D2 receptor have been proposed as potential modern therapeutics to treat schizophrenia and Parkinson's disease.

Methods: To address some subtle structural and stereochemical aspects of allosteric modulation of D2 receptor, we performed extensive in silico studies of both enantiomers of two compounds (compound 1 and compound 2), and one of them (compound 2) was synthesized as a racemate in-house and studied in vitro.

Results: Our molecular dynamics simulations confirmed literature reports that the R enantiomer of compound 1 is a positive allosteric modulator of the D2L receptor, while its S enantiomer is a negative allosteric modulator. Moreover, based on the principal component analysis (PCA), we hypothesized that both enantiomers of compound 2 behave as silent allosteric modulators, in line with our in vitro studies. PCA calculations suggest that the most pronounced modulator-induced receptor rearrangements occur at the transmembrane helix 7 (TM7). In particular, TM7 bending at the conserved P7.50 and G7.42 was observed. The latter resides next to the Y7.43, which is a significant part of the orthosteric binding site. Moreover, the W7.40 conformation seems to be affected by the presence of the positive allosteric modulator.

Conclusions: Our work reveals that allosteric modulation of the D2L receptor can be affected by subtle ligand modifications. A change in configuration of a chiral carbon and/or minor structural modulator modifications are solely responsible for the functional outcome of the allosteric modulator.

Keywords: Dopamine D2 receptor; GPCRs; Molecular dynamics; Molecular switches; Negative allosteric modulators; Positive allosteric modulators.


Conflict of interest statement

The authors declare no conflict of interest. The funders had no role in the design of the study; in the collection, analyses, or interpretation of data; in the writing of the manuscript, or in the decision to publish the results.

Figures

Fig. 1
Fig. 1
Structural formulas of the studied compounds 1 (21) and 2
Scheme 1
Scheme 1
1. Synthesis of compound 2. Reagents and conditions: EDC—N-(3-dimethylaminopropyl)-N′-ethylcarbodiimide, DCE—1,2-dichloroethane, rt—room temperature
Fig. 2
Fig. 2
The superimposition of TM2 of dopamine_DG1 complex simulation (yellow) and TM2 of three replicas (A–C) of R1_DG1 (cyan) after 1 µs MD simulations with conformational state described above. The structures are shown as cartoon for TM2 and ribbon for the rest of the receptor. ICL3 was truncated for clarity
Fig. 3
Fig. 3
Crucial amino acid interactions within G protein coupling domains in R1_DG1 complexes. The structure of D2R is shown as yellow ribbons and the C-terminal part of α5-Gα as a green ribbon, whereas important amino acids are highlighted as sticks. Hydrogen bonds are marked as yellow dashes
Fig. 4
Fig. 4
Crucial amino acid interactions within G protein coupling domains in R1_DG2 complexes. The structure of D2R is shown as yellow ribbons and C-terminal part of α5-Gα as a green ribbon, whereas important amino acids are highlighted as sticks. Hydrogen bond marked as yellow dashes and salt bridges as pink dashes
Fig. 5
Fig. 5
Crucial amino acid interactions within G protein coupling domains in S1_DG1 (A) and S1_DG2 (B) complexes. The structure of D2R is shown as yellow ribbons and C-terminal part of α5-Gα as a green ribbon, whereas important amino acids are highlighted as sticks. Hydrogen bonds are marked as yellow dashes, salt bridges as pink dashes and π interaction as blue dashes
Fig. 6
Fig. 6
Crucial amino acid interactions within G protein coupling domains in R2_DG1 (A), S2_DG1 (B), R2_DG2 (C) and S2_DG2 (D) complexes. The structure of D2R is shown as yellow ribbons and C-terminal part of α5-Gα as a green ribbon, whereas important amino acids are highlighted as sticks. Hydrogen bonds are marked as yellow dashes and salt bridges as pink dashes
Fig. 7
Fig. 7
Representative poses of modulators (R1 and S1) after molecular dynamics simulations. A Drift of the S1 modulator from the initial docking position (red) through simulations. B Drift of the R1 modulator from the initial docking position (red) through simulations may result in a binding pose (green) distinct from that of S1. C The unique binding pose of R1 modulator shown from perspective of TM2, TM3 and ECL1
Fig. 8
Fig. 8
Statistical analysis of relationship between modulator type and motions of TM7 in Gi1-bound complexes. A and B Conformational space explored by enantiomers of compound 1 and 2, respectively, in terms of PC1 and PC2. Analysis was performed in a common space, and values presented in shades of red represent simulations with R enantiomer of compound 1 and simulations of the S enantiomer presented in blue. Conformations induced by the R enantiomer of compound 2 are presented in green, while tose of the S enantiomer in gray. C and D Projections of extreme PC values on trajectories of TM7 in terms of PC1 and PC2, respectively, with a model of the receptor in the background for the context. Colour coding of TM7 conformations corresponds to panel A
Fig. 9
Fig. 9
Statistical analysis of relationship between modulator type and motions of TM7 in Gi2-bound complexes. A and B Conformational space explored by enantiomers of compound 1 and 2, respectively, in terms of PC1 and PC3. Shades of red represent simulations with R enantiomer of compound 1, and simulations of the S enantiomer presented in blue. Conformations induced by the R enantiomer of compound 2 are presented in green, while those of the S enantiomer in gray. Trajectories containing PAM are grouped in the upper left part of the diagram, while NAM-containing systems are apparent in the lower right. Simulations with SAM are grouped along a diagonal separating simulations with PAM and SAM. C Projections of extreme PC values on trajectories of TM7 in terms of PC1 and PC2, overlapped in one frame, with a model of the receptor in the background for the context. Colour coding of TM7 conformations corresponds to panel A. Decreased distance to TM6 is a common feature of low PC1 values and high PC3 values, corresponding to space occupied by PAM-containing complexes. Analogically, high PC1 values and low PC3 values are characterized by decreased distance between TM7 and TM2
Fig. 10
Fig. 10
Values of χ1 dihedral of W7.40 in all simulations
Fig. 11
Fig. 11
Competition radioligand binding assays of compound 2 at human D2 receptors. veh, vehicle (0.1% DMSO). The graph shows the data (mean ± SEM) of two independent experiments performed in duplicate. *P < 0.05 for vehicle vs. compound 2, two-way ANOVA and Sidak's multiple comparisons test
Fig. 12
Fig. 12
Functional assays of cAMP signalling for compound 2 at human D2 receptors. A Cells stably expressing D2 receptors were exposed to vehicle (veh, 1% DMSO) or 10 µM compound 2, and basal (no forskolin added) and 10 µM forskolin (FSK)-stimulated cAMP levels were determined (agonist mode). Data are expressed as % of FSK-stimulated cAMP in cells exposed to FSK alone (absence of vehicle or compound 2). The graph shows the average (mean ± SEM) of normalized data from three (vehicle) to four (compound 2) independent experiments performed in sextuplicate or greater. ns, no statistically significant difference for vehicle vs. compound 2 (adjusted P values = 0.9999 and 0.9720 in basal and forskolin-stimulated conditions, respectively; one-way ANOVA (F3,10 = 90.45, p < 0.0001) and Sidak's multiple comparisons test). Average cAMP concentrations in our assays were (mean ± SEM) 0.78 ± 0.31 nM and 8.91 ± 2.18 nM for basal and forskolin-stimulated cells, respectively (absence of vehicle or compound 2) (not shown), 0.48 ± 0.04 nM and 4.97 ± 0.42 nM for basal and forskolin-stimulated cells, respectively (vehicle-treated cells), and 0.58 ± 0.03 nM and 7.46 ± 2.38 nM for basal and forskolin-stimulated cells, respectively (compound 2-treated cells). B Effect of 100 nM quinpirole on forskolin (FSK)-stimulated cAMP production in the presence of vehicle (veh, 1% DMSO) or 10 µM compound 2, in cells stably expressing D2 receptors. Data are expressed as % of FSK-stimulated cAMP in the absence of quinpirole at each condition (vehicle or compound 2). The graph shows average (mean ± SEM) of normalized data from two (vehicle) to three (compound 2) independent experiments performed in sextuplicate or greater. *p < 0.05, unpaired t test (t3 = 3.383, p = 0.0430)
Fig. 13
Fig. 13
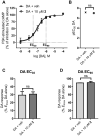
Effects of compound 2 on dopamine response (inhibition of forskolin-stimulated cAMP production) in functional assays of cAMP signalling at human D2 receptors. Cells stably expressing D2 receptors were incubated for 1 h in the presence of vehicle and/or ligands and 10 µM forskolin. A Dopamine (DA) concentration–response curves in the presence of vehicle (veh, 1% DMSO) or 10 µM compound 2. Response is expressed as % of the maximal inhibition elicited by dopamine in the absence of vehicle or compound 2 (“DA alone”). The graph shows average (mean ± SEM) of normalized data from two (vehicle) to four (compound 2) independent experiments performed in sextuplicate. B Potency (pEC50) of dopamine in the presence of vehicle or 10 µM compound 2 in these cAMP assays. The graph shows average (mean ± SEM) pEC50 values from the individual experiments considered in A). ns, no statistically significant difference for vehicle vs. compound 2 (p > 0.05, unpaired t test) (t4 = 0.669, p = 0.5401). C, D Bar graphs showing dopamine response in the presence of vehicle or compound 2, at dopamine concentration data points close to dopamine EC30 (C) or EC90 (D) as extracted from the dopamine concentration–response curves from the individual experiments considered in A). ns, no statistically significant difference for vehicle vs. compound 2 (p > 0.05, unpaired t test) (t4 = 0.2609, p = 0.8071; t4 = 0.1521, p = 0.8865, for dopamine EC30 (C) and dopamine EC90 (D), respectively). Average cAMP concentrations in the absence of vehicle or compound 2 (“DA alone”) were (mean ± SEM) 0.36 ± 0.04 nM, 21.5 ± 5.5 nM, and 5.01 ± 1.62 nM for basal (not forskolin-stimulated), forskolin-stimulated, and forskolin + maximal dopamine-stimulated cells, respectively (not shown)

Similar articles

Cited by

References

    1. Giros B, Sokoloff P, Martres MP, Riou JF, Emorine LJ, Schwartz JC. Alternative splicing directs the expression of two D2 dopamine receptor isoforms. Nature. 1989;342(6252):923–926. - PubMed
    1. Martel JC, Gatti MS. Dopamine receptor subtypes, physiology and pharmacology: new ligands and concepts in schizophrenia. Front Pharmacol. 2020;11:1003. - PMC - PubMed
    1. Guiramand J, Montmayeur JP, Ceraline J, Bhatia M, Borrelli E. Alternative splicing of the dopamine D2 receptor directs specificity of coupling to G-proteins. J Biol Chem. 1995;270(13):7354–7358. - PubMed
    1. Jomphe C, Tiberi M, Trudeau L-E. Expression of D2 receptor isoforms in cultured neurons reveals equipotent autoreceptor function. Neuropharmacology. 2006;50(5):595–605. - PubMed
    1. De Mei C, Ramos M, Iitaka C, Borrelli E. Getting specialized: presynaptic and postsynaptic dopamine D2 receptors. Curr Opin Pharmacol. 2009;9(1):53–58. - PMC - PubMed

LinkOut - more resources