iBet uBet web content aggregator. Adding the entire web to your favor.


Link to original content: http://pubmed.ncbi.nlm.nih.gov/34961794/
Histone variant H3.3 maintains adult haematopoietic stem cell homeostasis by enforcing chromatin adaptability - PubMed Skip to main page content
U.S. flag

An official website of the United States government

Dot gov

The .gov means it’s official.
Federal government websites often end in .gov or .mil. Before sharing sensitive information, make sure you’re on a federal government site.

Https

The site is secure.
The https:// ensures that you are connecting to the official website and that any information you provide is encrypted and transmitted securely.

Access keys NCBI Homepage MyNCBI Homepage Main Content Main Navigation
. 2022 Jan;24(1):99-111.
doi: 10.1038/s41556-021-00795-7. Epub 2021 Dec 27.

Histone variant H3.3 maintains adult haematopoietic stem cell homeostasis by enforcing chromatin adaptability

Affiliations

Histone variant H3.3 maintains adult haematopoietic stem cell homeostasis by enforcing chromatin adaptability

Peipei Guo et al. Nat Cell Biol. 2022 Jan.

Erratum in

Abstract

Histone variants and the associated post-translational modifications that govern the stemness of haematopoietic stem cells (HSCs) and differentiation thereof into progenitors (HSPCs) have not been well defined. H3.3 is a replication-independent H3 histone variant in mammalian systems that is enriched at both H3K4me3- and H3K27me3-marked bivalent genes as well as H3K9me3-marked endogenous retroviral repeats. Here we show that H3.3, but not its chaperone Hira, prevents premature HSC exhaustion and differentiation into granulocyte-macrophage progenitors. H3.3-null HSPCs display reduced expression of stemness and lineage-specific genes with a predominant gain of H3K27me3 marks at their promoter regions. Concomitantly, loss of H3.3 leads to a reduction of H3K9me3 marks at endogenous retroviral repeats, opening up binding sites for the interferon regulatory factor family of transcription factors, allowing the survival of rare, persisting H3.3-null HSCs. We propose a model whereby H3.3 maintains adult HSC stemness by safeguarding the delicate interplay between H3K27me3 and H3K9me3 marks, enforcing chromatin adaptability.


Conflict of interest statement

Competing interests

S.R. is the non-paid co-founder of Angiocrine Bioscience (San Diego). The other authors declare no competing interests.

Figures
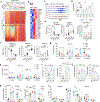
Extended Data Fig. 1 |
Extended Data Fig. 1 |. H3.3A and H3.3B are redundant during steady state hematopoiesis.
a. the Fragments Per Kilobase of transcript per Million mapped reads (FPKM) of H3.3A and H3.3B in hematopoietic cells. LT-HSC, long-term hematopoietic stem cells; MPP, multipotent progenitor cells; CMP, common myeloid progenitor cells; GMP, granulocyte macrophage progenitor cells; MEPs, megakaryocyte erythroid progenitor cells. Mono, Monocytes; Mac, macrophages; DCs, dendritic cells; CD11b+Gr1+ cells, granulocytes. The number of dots indicated the number of biological replicates. b. The design of the H3.3Afl/fl allele and the H3.3BEYFP/mcherry knockin knockout allele. c. qRT-PCR quantification of H3.3A mRNA expression within LKS cells after tamoxifen treatment. TKO is Id1mut/mut; DKO mice. d-e, genotyping of Rosa26creERT2, H3.3A floxed, WT, and deletion allele; H3.3B-EYFP or H3,3-mcherry allele (n>3 biological replicates were used). f-g. Percentages and numbers of c-Kit+Sca1+Lin (LKS) or c-Kit+Sca1Lin LK cells within control (+/+, H3.3A+/, or H3.3B+/), H3.3AiKO/iKO (AKO), and H3.3B/ (BKO) mice. h. Percentages of LKS and LK cells among LinN cells of control, AKO, and BKO mice. i. percentages of lineage cells within BM or spleen of control, AKO, and BKO mice. j. The total number of cells within BM, spleen, and thymus of H3.3B+/ (Bhet) or BKO mice. k-l, The total number of lineage cells with BM and spleen or Bhet or BKO mice. m-n, Recovery after myelosuppression with sublethal total body irradiation at 600 cGy. m, Survival probability after total body irradiation. n. white blood cells (WBC), red blood cells (RBC) and platelets (PLT) in the PB of control or BKO mice. o. Trimethylation at histone 3 lysine 27 (H3K27me3) profiling at WT or BKO LKS cells. Genome-wide, there were 3925 regions with reduced H3K27me3 enrichment. p. 210 of the H3K27me3 reduced regions in BKO LKS cells colocalize with H3.3 enrichment. q-r. We also profiled the enhancer mark, H3K27ac in BKO or WT cells, and identified the regions with increased or decreased H3K27ac enrichment. Motifs within those regions are also shown. For panels a, c, f-l, the number of dots indicate the number of animals. For m, n, n=5 mice for control group and n=9 for BKO group. Error bars indicate standard error of mean. p-value is calculated using unpaired, 2-tailed t-test. For h, p-value for the data points at day 27 was calculated using unpaired, 2-tailed t-test. Numerical source data are provided in Source Data.
Extended Data Fig. 2 |
Extended Data Fig. 2 |. Adult inducible deletion of H3.3A, but not its chaperone Hira resulted in myeloid bias.
a. FPKM of total H3.3, calculated as the sum of H3.3A and H3.3B, Hira, and Daxx in hematopoietic cells. b. Survival probability of DKO or BKO mice following tamoxifen treatment. c. Representative flow cytometric plots for the gating of LKS cells, LT-HSCs (CD150+CD48 LKS), MPP3 (CD150CD48+ LKS), MPP2 (CD150+CD48+ LKS), and ST-HSCs (CD150CD48 LKS) for BKO, DKO, Hirafl/fl or HiraKO mice. d-e. The percentages and the total number of LT-HSCs, MPP3, ST-HSCs, and LKS cells. f. The total number of progenitor cells at 2–3 weeks after H3.3 or Hira deletion. GMP, CD16/32+CD34+LK; MEPs, CD16/32CD34LK-cells; CMP, CD16/32CD34+LK. g. At week 2, 3, 4, or 7 after tamoxifen injection, the upregulation of GMP marker CD16/32 on LKS and LT-HSCs in DKO mice. h. BM, spleen, and thymus of BKO, DKO, Hirafl/fl or HiraKO mice. Note the BM anemia phenotype and enlarged spleen for DKO mice. On the right, the spleen weight and thymocytes numbers are shown for HiraKO mice. i. CBC for BKO, DKO, Hirafl/fl or HiraKO mice. j-k. the percentages of granulocytes or B cells in the spleen or BM. l-n, the percentages of CD4+, CD8+, and CD4+CD8+ cells within BM, spleen, and thymus of the indicated mice. o. Representative flow cytometric plots of the erythroid cell clusters II-V. p-q. the percentages and numbers of Ter119+, erythroid cells II, III, IV, and V within the BM and spleen of BKO, DKO, Hirafl/fl, and HiraKO mice. For panels 2a, c, e-n, p-q, the number of dots indicates the number of animals Error bars indicate standard error of mean (SEM). P-values are calculated using unpaired, two-tailed, t-test. ‘ns’, non-significant. Numerical source data and unprocessed gels are provided in Source Data.
Extended Data Fig. 3 |
Extended Data Fig. 3 |. Histology of hematopoietic organs demonstrated myeloid hyperplasia in H3.3DKO mice.
a. Hematoxylin and eosin (HE) staining of the BM epiphysis and diaphysis of BKO, DKO, Hirafl/fl, and HiraKO mice. Note the increased bone mass and reduced hematopoietic cells in the epiphysis region of DKO mice, compared with BKO mice. b-d. HE staining of spleen (b), liver (c), and thymus (d) for BKO, DKO, Hirafl/fl, and HiraKO mice. Note the significantly smaller white pup in the spleen of DKO, but not that of HiraKO mice; the infiltration of hematopoietic cells in the liver of DKO mice, but not that of HiraKO mice. For a-d, n=4 independent animals for each genotype. e. Quantification of the percentages of the white pulp area in the spleens of BKO and DKO mice. The number of dots indicates the number of independent animals per experiment. The experiment in a-e were repeated 2–3 times. Error bar indicates SEM. P-value was calculated using two-tailed t-test. f. HE staining of lung, heart, and kidney from BKO and DKO mice. There were leukocyte infiltrations in the heart and kidney of DKO mice. g. Qiff-quik staining of BMMNCs and PB of BKO and DKO mice. Upper panel, BMMNCs, note the presence of red blood cells and lymphocytes in the BKO mice; however, DKO mice demonstrated myeloid hyperplasia, erythroid hypoplasia, and Peudo-Pelger huet cells (white arrows). Middle and lower panels, PB. In BKO PB, there were lymphocytes, RBCs, and neutrophils; in DKO mice, the PB contains predominantly myeloid cells (myeloid hyperplasia), including nucleated red cells, hypogranular neutrophils, ring-shaped neutrophils, myelocytes, myelocyte with micronuclei, and hyperlobated megakaryocytes (stag-horn shaped). For g, scale bar is 50 μm for each figure panel. For f-g, n=3 biological samples were used. Numerical source data are provided in Source Data.
Extended Data Fig. 4 |
Extended Data Fig. 4 |. H3.3 maintains hematopoietic homeostasis and HSC repopulation.
a. Percentages of CD45.2+ cells at the week 0 and week 4 after tamoxifen injection; note the absence of DKO-CRA cells in the PB of recipients CD45.1+ recipients before tamoxifen induced deletion of H3.3A gene, suggesting a disadvantage of BKO HSPCs to repopulate the wild type BM in a competitive setting. Experiments were repeated twice; each with n=4 animals for each group. b. Survival probability of mice with different transplantation schemes. c. Representative flow cytometric plots for CD16/32+ LKS cells in the recipients transplanted with DKO or AKO BMMNCs. d. Percentages of B220+ B cells and CD11b+Gr1+ granulocytes in the spleen of recipients transplanted with DKO or AKO BMMNCs. e. Percentages of B220+ B cells, Gr1+ myeloid cells, and CD3+ T cells in the PB of recipients transplanted with DKO or AKO BMMNCs. f-g. Images showing the skin lesions of the DKO BMMNCs-transplanted recipient animals, at week 7 after H3.3A deletion. The frequency, onset, and treatment for such skin lesion is listed in g. h-k. Hematoxylin and eosin (H and E) staining of BM, spleen, liver, and lung of recipients transplanted with DKO or AKO BMMNCs (n=3 for DKO, n=4 for AKO). For the BM, note the hypocellularity and sclerosis at the epiphysis and metaphysis regions. For the spleen, note the purple pro-fibrotic fibrous structures and disappearances of white pups in the DKO mice. There was no apparent hematopoietic cell infiltration into the liver for DKO BMMNC cells transplanted mice. For a, p-value is calculated using two-way ANOVA. For panels d, e, the number of dots indicates the number of independent animals. Error bars indicate standard error of mean. For d, e, p-value is calculated using unpaired, two-tailed t-test; the number of dots equals to the number of biological replicates in d, e. Numerical source data are provided in Source Data.
Extended Data Fig. 5 |
Extended Data Fig. 5 |. H3.3 maintains HSC repopulation in a competitive setting.
a. Representative flow cytometric plots for the CD45.2+ LinN cells and LT-HSC at week 16 following tamoxifen injection. b. The percentage and total number of CD45.2+ LinN cells within the BM of recipient mice. c. The percentages of CD45.2+ cells within the BM, spleen, and thymus of recipient mice. d-e. The total numbers of stem and progenitor cells, and lineage positive cells within the BM of recipient mice. f-g. Representative flow cytometric plots for the lineage cells (CD11b+, CD11b+Gr1+, Gr1+, or B220+ cells) within the BM or spleen of recipient mice. h. Representative flow cytometric plots for lineage cells (CD4+, CD8+, or CD4+CD8+ double positive cells) within thymus or spleen. i-j. The percentages of lineage-specific cells within BM or spleen of the recipients. k-l, The percentages of lineage cells within thymus or spleen of the recipients. For all the panels, n=6 animals for AKOBhet group; n=6 animals for DKO group. Error bars represent standard error of the mean. p-value is calculated using unpaired, 2-tailed t-test.
Extended Data Fig. 6 |
Extended Data Fig. 6 |. H3.3 prevents HSC myeloid differentiation.
a. Representative flow cytometric plots for the kinetics of LKS cell at different time points after tamoxifen treatment. Note the emergence of CD16/32+ LKS cells with the increase of culture time, and the elevated percentages of CD16/32+ cells in DKO LKS cells, compared with BKO LKS cells. b. percentages of the CD16/32+ among LK or LKS cells. c. Representative flow cytometric plots for the LT-HSCs during the co-culture. d. Lineage differentiation potential of BKO and DKO cells. There is reduced capacity for DKO to differentiate into B220+ B cells; overexpressing H3.3 did not rescue this defect. e. We set up in vitro culture assays for Hirafl/fl and Rosa26creERT2+ ;Hirafl/fl (HiraKO) HSCs. The growth curve of total hematopoietic cells are shown. f. the growth kinetics of total number of CD16/32+LKS cells. g. Representative flow cytometric plots for the LKS cells, LT-HSCs, GMPs, and CD16/32+ LKS cells in Hirafl/fl or HiraKO cultures. h-i, at day 4 after Hira deletion, the percentages and total numbers of LK, CMPs, GMPs, MEPs, and CD16/32+ LKS cells. j-k. the percentages and the total numbers of lineage cells, including B220+ B cells, CD11b+Gr1+ early myeloid cells, and CD11b+Gr1+ granulocytes. For panels 6b, d, e-f, h-k, the number of dots indicate the number of independent biological samples per experiment. Error bars indicate standard error of mean (SEM). For panels d, h, and i, P-values were calculated using unpaired, two-tailed, t-test; for panels b, e, f, j, and k, p-value was calculated using two-way ANOVA. Numerical source data are provided in Source Data.
Extended Data Fig. 7 |
Extended Data Fig. 7 |. H3.3 enrichment colocalizes with active histone marks H3K4me3 and repressive histone mark H3K27me3 or H3K9me3 within HSPCs.
a. Schematic view of the H3.3B-HA-IRES-mcherry knockin mice used to map the H3.3 binding site within HSPCs. Lin cells were co-cultured with E4-HUVECs for 1 week to expand LKS cells; ChIP-seq was performed using HA antibody. n=1 biological sample. b. Genome-wide distribution of 30,651 H3.3 peaks in LKS cells. Across the genome, there are 14,720 H3K4me3_H3.3 overlapped peaks (c), 2,012 H3.3 dependent H3K4me3/H3K27me3 bivalent peaks (d), and 3,484 H3K9me3_H3.3 overlapped peaks (f). e. The genome-wide localization of the H3.3 dependent H3K4me3/H3K27me3 regions. g. The genome-wide localization of the H3.3 dependent H3K9me3 marked regions. For panels c, d, e, f, ChIP-seq for histone modifications H3Km4e3, H3K9me3, H3K27me3 has been performed on n=3 biological samples. h. Genes at or near the H3.3-dependent H3K4me3/H3K27me3 bivalent regions. i. Genes at or near the H3.3 dependent H3K9me3 marked regions. j. There are a total of 9,031 genes with H3.3-dependent H3K4me3 enrichment, 2,533 genes with H3.3-dependent H3K9me3 enrichment, and 1,722 genes with H3.3-dependent H3K4me3/H3K27me3 enrichment. The expression levels of these three categories of genes are shown for both LT-HSCs and LKS cells. p-values were calculated using two-tailed t-test using one biological sample for each cell type. The experiment was repeated three times. The boundaries of box indicate the 25 and 75 percentiles, center indicate median number, whiskers indicate 1.5X interquartile range. k. Representative genome browser view of enrichment of H3.3, H3K4me3, H3K9me3, H3K27me3, H3K27ac and mRNA expression levels for active genes, bivalent genes and repetitive elements. Also shown here is the genome browser view of H3.3 enrichment using anti-H3.3 antibody, kindly shared by another group. P-value is labelled on the top of the box plot in panel j.
Extended Data Fig. 8 |
Extended Data Fig. 8 |. Dynamic changes of transcriptomic landscape within HSPCs following H3.3 deletion in vitro and in vivo.
a-b, DAVID gene ontology biological pathway of differentially expressed genes (DEGs) at day 14-post H3.3 deletion in DKO LKS cells, compared with BKO LKS cells (in vivo). c-d, DAVID gene ontology biological pathway analysis of DEGs at day 56 post H3.3 deletion in DKO LKS cells, compared with BKO LKS cells (in vivo). e-f, the mean tag density of H3K4me3 and H3K9me3 at the promoter regions of the 385 downregulated genes associated with PC1. P-values were calculated using unpaired two-tailed t-test using one biological sample of each genotype. The experiment was performed twice independently for d14, once for d49, d56, and once for Hirafl/fl and HiraKO. g. Representative genome browser view of H3K4me3 and H3K27me3 intensity at intergenic region, at day 14 and day 56 post H3.3A deletion. h-k. For the commonly upregulated genes at d14 and d56 (171 genes), the enrichment of histone modifications H3K27me3, H3K27ac, H3K4me3, and H3K9me3 at the promoter regions is shown. For panels h-k, P-values were calculated using unpaired two-tailed t-test using one biological sample of each genotype. The experiment was performed twice independently for d14, once for d49, d56, and once for Hirafl/fl and HiraKO. l. Downregulation of key genes involved in erythrocyte differentiation within DKO LKS cells, compared with BKO LKS cells (n=2 biological samples). m, Venn diagram showing the overlap between the H3K27me3-reduced peaks within H3.3DKO cells and HiraKO LKS cells. n. The genome-wide distribution of DKO only, HiraKO and H3.3DKO shared, and HiraKO only H3K27me3-reduced peaks. o. The genes nearby the H3K27me3_reduced peaks are enriched in distinct biological pathways, as shown in the table. p. The H3K27me3 enrichment around the promoter regions of Id1 gene in Hirafl/fl or HiraKO LKS cells. For 8l, error bar indicates standard error of the mean. For the box plots in panels e-f, h-k, the boundaries of box indicate the 25 and 75 percentiles, center indicate median number, whiskers indicate 1.5X interquartile range. For e,-f, h-k, and o, p-values were calculated using two-tailed t-test. P-value is indicated on top of the box plot in panels e and f.
Extended Data Fig. 9 |
Extended Data Fig. 9 |. Dysregulated ERV expressions in H3.3DKO LKS cells triggered interferon responses, responsible for the myeloid bias.
a. H3K9me3 enrichment at representative ERV family. p-value was calculated using unpaired two-tailed t-test using one biological sample for each genotype. The experiment was repeated twice independently. b. The dynamic changes of ERV mRNA expression at in vitro or in vivo settings with DKO and BKO LKS cells (n=1 biological sample for each column). For the box plots in a, b, the boundaries of box indicate the 25 and 75 percentiles, center indicate median number, whiskers indicate 1.5X interquartile range. c. Genome browser plots showing the reduction of H3K9me3 and increased mRNA expression at a IAPEz-int ERV region. d. qRT-PCR quantifications of ERV expression at in vivo or in vitro LKS cells. env encodes for the envelope protein of ERV1. The number of dots indicate the number of biological samples]. e. At day 4 after in vitro deletion of H3.3A gene, the biological pathways associated with upregulated DEGs. f. We performed ChIP-seq for H3K27ac, an enhancer mark. The motifs within the H3K27ac increased regions include interferon pathway downstream transcription factor, Irf. g. The experimental scheme to test the effect of Jak2 inhibitor Ruxolitinib on the expansion and differentiation of HSPCs. h. Representative flow cytometric plots for the LKS, CD16/32+ LKS cells, pre-MegE, and pre-GM populations within the cocultures. i. The percentages of lineage positive cells within the total cultured cells. CD11b+Gr1+, immature neutrophils; CD11b+Gr1high, mature neutrophils. j. Representative flow cytometric plots for the lineage cells within the cocultures. k-m, at in vitro cultures, the mRNA expression of H3.3A, Hira, and Daxx within LKS cells. n-o, Daxx or Hira mRNA expression within LKS cells, GMPs, and LinP cells at in vivo scenarios. p-r, another batch of in vivo experiments, the mRNA expression of H3.3A, Hira, and Daxx within LKS cells was quantified. For panels I, k-m, o-s, the number of dots indicate the number of independent biological samples. Error bars indicate SEM. p-value is calculated using unpaired, two-tailed t-test unless otherwise indicated on the plot. P-value for panel a is labelled in the legend; p-value for panel b is not shown. Numerical source data are provided in Source Data.
Extended Data Fig. 10 |
Extended Data Fig. 10 |. Reduction of H3K9me3 opens up the accessibility of transcription factor binding sites.
a. Heatmap showing the increased ERV RNA expression within DKO LKS cells, compared with BKO LKS cells in chromosome 1. b. Heatmap showing the decreased ERV RNA expression within DKO cells, compared with BKO LKS cells. c. There is no H3K9me3 reduction mountain in HiraKO LKS cells. d. The H3K9me3 mountain in DKO cells persist into later stage d56 after H3.3A deletion. e. Karyotype plot showing the localization of H3K9me3 mountain in BKO LKS cells (blue bars), reduced H3K9me3 mountain in D4 DKO LKS cells (in vitro) (red triangle), and commonly reduced H3K9me3 mountains within three biological replicates. f. Karyotype plot showing the localization of H3K9me3 mountain in BKO LKS cells (blue bars), reduced H3K9me3 mountain in DKO LKS cells (red triangle), and commonly reduced H3K9me3 mountains within LKS and LK cells. g. The increased mRNA expression near decreased H3K9me3 peaks (distance from TSS < 10Kb) (n=2 biological samples). h. GMP marker Fcgr2b mRNA is upregulated in DKO HSPCs. Near Fcgr2b gene, there is increased H3K9me3 enrichment at ERV site, putative IRF binding site and Terra binding site. i. Heatmap showing the expression of interferon target genes in BKO or DKO LKS cells, BKO or DKO GMPs. The gene with increased mRNA expression in DKO LKS cells compared with BKO LKS cells were labelled in bold. j, example of reduced mRNA expression near the H3K9me3_reduced_ERV regions. k-m. Kaplan Meyer survival curve for acute myeloid leukaemia patients striated according to the mRNA expression level of RELB (k), SETDB1 (k), and TRIM28 (l). For k and m, p-values were calculated using log-rank test. Error bars represent SEM. Numerical source data and unprocessed blots are provided in Source Data.
Fig. 1 |
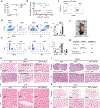
Fig. 1 |. H3.3 maintains adult haematopoiesis and HSC repopulation.
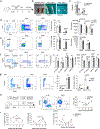
a, Schematic view of non-competitive transplantation experiments. b, Images of the spleen (left), femur (middle) and thymus (right) of the recipients transplanted with induced KO (iKO) including H3.3AiKO/iKO (AKO), H3.3AiKO/+H3.3B+/− (heterozygous H3.3A-KO and heterozygous H3.3B-KO; AhetBhet) or DKO BMMNCs at 4 weeks following tamoxifen treatment. c, Weight of the spleen and thymus of the recipients of AKO, AhetBhet or DKO BMMNCs. d, Representative flow cytometry plots (left), percentages (middle) and the total number of LKS cells (right) in the mice described in a. e, Representative flow cytometry plots (left), percentages (middle) and the total number of CD16/32+ CD34+c-Kit+Sca1Lin GMPs and CD16/32+ LKS cells (right) in the recipients described in a. f, Representative flow cytometry plots (left), percentages (middle) and the total number of MPP3, MPP2, LT-HSC and ST-HSC (right) cells in the recipients described in a. g, Representative flow cytometry plots (left), percentages (middle) and numbers (right) of B cells in the BM of the recipients described in a. ag, n = 4 AKO mice and n = 3 DKO mice. h, Schematic of the competitive transplantation assay used to test the engraftment of DKO BMMNCs (left). Representative flow cytometry plots showing the percentage of CD45.2+ cells in the peripheral blood of the CD45.1 recipients (middle). Percentages of CD45.2+ cells in the peripheral blood of the CD45.1 recipients at different time points (right). i, Multilineage engraftment for the CD45.2+ BMMNCs cells from AKOBhet and DKO mice. h,i, n = 4 animals per experiment. The experiment was repeated twice. ci, The P values were calculated using an unpaired two-tailed Student’s t-test (cg) or a two-way analysis of variance (ANOVA; h,i) and are indicated on the graphs; NS, not significant. The error bars represent the s.e.m. dh, The percentage of cells in the different quadrants or boxes in the flow cytometry plots are indicated. Tam, tamoxifen. Numerical source data are provided.
Fig. 2 |
Fig. 2 |. H3.3 maintains HSC quiescence and blocks myeloid differentiation.
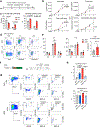
a, Schematic view of the in vitro HUVEC–HSPC co-culture experiment. The cell-cycle and apoptosis status of the cells was evaluated 3 d after tamoxifen treatment; the total number of LKS and lineage cells were quantified 8 d after the tamoxifen (Tam) treatment. b, Total number of haematopoietic, LinN, LKS and CD16/32 LKS cells at different time points during the co-culture. c, Percentages of LK and LKS cells in the LinN cell populations (left). Percentages of CD16/32+ LK and LKS cells at day 7 post tamoxifen treatment (right). d, Representative flow cytometry plots for the analysis of the cell-cycle status of LK and LKS cells on day 3 after H3.3A deletion. e, Percentages of cells in different stages of the cell cycle (LK, left; LKS, right) and the percentage of LKS cells in apoptosis. f, We carried out a rescue experiment using lentiviral-mediated overexpression of H3.3. The lentiviral construct (left) and the experimental scheme (right) are shown. Due to the limited transduction efficiency of lentivirus into LKS cells, we used H3.3BmCherry/mCherry BKO or Rosa26cre+H3.3Afl/flH3.3BmCherry/mCherry DKO cells. g, Representative flow cytometry plots for the LK and LKS cells following H3.3 overexpression. Overexpression of H3.3 (mCherry+EYFP+ cells) has reduced expression of the CD16/32+ marker in both LKS and LK DKO cells (top). Overexpression of H3.3 increased the expression of CD16/32+ in LKS BKO cells (bottom). d,g, The percentage of cells in the boxed regions in the flow cytometry plots are indicated. h, Percentages of CD16/32+ BKO, BKO + H3.3, DKO and DKO + H3.3 LKS (top) and LK (bottom) cells. Error bars represent the s.e.m.; n = 3 independent biological samples for all panels, except the apoptosis assay in e, where n = 4. The P values were calculated using an unpaired two-tailed Student’s t-test (c,e,h), two-way ANOVA (b, total, LinN and LKS cells) or a two-tailed Student’s t-test (b, CD16/32 LKS cells on day 8) and are indicated on the graphs; NS, not significant. Numerical source data are provided.
Fig. 3 |
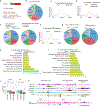
Fig. 3 |. H3.3-null HSPCs demonstrated a GMP-like transcriptomic signature and a predominant gain of H3K27me3 marks.
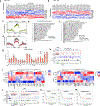
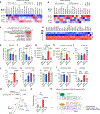
a,b, Number of upregulated (a) and downregulated (b) DEGs on days 15, 21 and 56 after H3.3A deletion (P < 0.05; FC > 1.8). The P values were calculated using a two-tailed Student’s t-test. The total numbers of genes that are upregulated or downregulated at the different time points are shown in red (a) and blue (b), respectively. c, We arbitrarily divided the time following H3.3 deletion into early–mid and mid–late stages. The early–mid DEGs are enriched for apoptosis, T-cell cytotoxicity and positive regulation of TNF-ɑ. The mid–late stage DEGs are enriched for the cell-cycle, mitotic-spindle organization, phagocytosis and myeloid cell biological pathways. d, HSPC transcriptome. Principal component (PC) analysis of FPKM values in different samples, using the most variably expressed genes including the DEGs at early (n = 1,450) and late (n = 329) time points after H3.3 deletion, and the DEGs between Hirafl/fl and Hira-KO HSPCs (n = 313). e, Heatmap showing the expression of the top 159 genes associated with PC1 in LKS cells from BKO, Hirafl/fl, Hira-KO and DKO mice as well as GMPs from BKO and DKO mice. Among the top 159 genes associated with PC1, five are increased in DKO LKS cells; the remaining 154 genes are downregulated. f, In the differentiation of LKS cells towards GMPs, there are 513 and 2,524 genes that are significantly upregulated and downregulated, respectively (left). Percentage of overlap between the up- and downregulated genes in DKO cells relative to BKO cells (y axis) and the up and downregulated genes from LKS-to-GMP differentiation (x axis; right). g, Levels of H3K27me3 enrichment at the promoter regions (TSS ± 3 kb) of the top 385 downregulated genes associated with PC1. The experiment was repeated twice independently for the BKO and DKO cells at each time point; the experiment was performed once for the Hirafl/fl and Hira-KO cells. h, H3K27ac profiles at the promoter regions of the top 385 downregulated genes associated with PC1. The experiment was repeated twice independently for each column. g,h, The P values were calculated using an unpaired two-tailed Student’s t-test using one biological sample for each genotype and are indicated on the graphs. In the box-and-whisker plots, the boundaries of the box indicate the 25th and 75th percentiles, the centre line indicates the median and the whiskers (dashed lines) indicate 1.5× the interquartile range. i, Correlation between the mRNA level changes of the 385 downregulated genes (FPKM) and the density of H3K27me3 around the promoter (DKO/BKO FC); r, coefficient of multiple correlation. j, Globally, a larger number of regions had increased H3K27me3-peak intensity than decreased H3K27me3-peak intensity in DKO LKS cells compared with BKO LKS cells. k, Genome-wide distribution of the H3K27me3-decreased (left) and H3K27me3-increased (right) peaks. l, Representative genome browser track showing the reduced H3K4me3 and increased H3K27me3 at the Eya2 promoter locus on days 14 and 56 after H3.3 deletion in vivo. m, H3.3 enrichment at the 385 downregulated genes associated with PC1 compared with all promoters. n, H3.3 enrichment at the H3K27me3-reduced regions and H3K27me3-increased regions. There is more H3.3 enrichment at the H3K27me3-increased regions compared with the H3K27me3-reduced regions.
Fig. 4 |
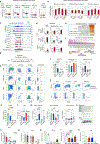
Fig. 4 |. Id1 deletion does not rescue the increased myelopoiesis in DKO mice.
a, Histograms (top) and heatmap (bottom) showing the H3K27me3 mean tag density at H3K27me3-reduced regions in BKO, DKO, Hirafl/fl and Hira-KO LKS cells. The heatmap shows the H3K27me3-reduced regions for the DKO only, DKO and Hira-KO shared and Hira-KO only cells. b, FPKM levels of genes with concomitant promoter-region H3K27me3 reduction and increased mRNA expression levels in DKO HSPCs. Aatk.1 and Aatk.2 are two isoforms of Aatk. c, The gene with the highest H3K27me3 reduction, ranked according to the FC, is Id1. d, Expression levels of Id1 mRNA in BKO, DKO, Hirafl/fl and Hira-KO LKS cells as well as BKO and DKO GMPs. e,f, We crossed DKO mice with Id1-mutant mice and generated Rosa26creERT2+H3.3Afl/flH3.3B−/−Id1−/− mice. After tamoxifen-induced H3.3A deletion, the resulting mice were termed TKO mice. The total number (e) and percentages (f) of neutrophils, lymphocytes and basophils in the peripheral blood of the indicated mice were determined. g,h, Percentage (g) and total number (h) of LT-HSCs, ST-HSCs, and MPP3 and MPP2 cells in BKO, DKO and TKO mice. i, Percentage of GMPs in the LK cell populations (left) and of CD16/32+ cells in the LKS cell populations (right). j, Spleen and thymus weight (normalized to the body weight of the mouse) for the BKO, DKO and TKO mice. k, Percentage of lineage cells in the spleen (left) and BM (right) of the TKO mice. l, Percentage of T cells in the thymus (left) and spleen (right) of the TKO mice. DP, CD4+CD8+ double-positive cells, k,l, Each dot represents an individual mouse. Error bars represent the s.e.m. P values were calculated using an unpaired two-tailed Student’s t-test, except for the panel in Fig. 4i (P = 0.07), and are indicated on the graphs. NS, not significant. Numerical source data are provided.
Fig. 5 |
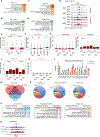
Fig. 5 |. Reduction of H3K9me3 and dysregulated ERV expression in DKO HSPCs.
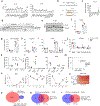
a, Heatmap showing the levels of H3K9me3 enrichment at representative ERV repfamilies in wild-type and DKO LKS cells (in vitro), and BKO and DKO LKS cells (in vivo). b, Levels of mRNA expression of representative ERV repfamilies. c, Molecular functions associated with upregulated DEGs in H3.3-null LKS cells. d, Levels of RNA expression of genes involved in the cellular response to interferon-β. e, Total number of BKO and DKO LKS cells following treatment with Rux or vehicle. f,g, Total number of LinN (f) and LKS (g) cells in the BKO and DKO cells following treatment with Rux or vehicle. h, Total number of CD16/32 LKS cells for the indicated treatment groups. i,j, Percentage of LK (i) and LKS (j) cells in the LinN cell populations during the co-culture. k, Percentage of CD16/32+ cells in the LK (right) and LKS (left) cell populations. l, Percentages of progenitors to granulocytes and macrophages (preGM; left) and pre-megakaryocyte-erythrocyte progenitors (preMegE; right) subpopulations in the CD16/32 LK (non-GMPs) cells. m, Cartoon showing the regulation of HSC proliferation and differentiation by Jak1–Jak2 signalling. MEP, megakaryocyte erythroid progenitor. n, Expression levels of Id1 in LKS cells for the indicated treatment groups. o, Working model. The expression of ERV is regulated by a ‘brake and accelerator’ mechanism. H3.3-mediated H3K9me3 deposition serves as a repressive histone modification brake (i); when H3.3 is deleted, the brake is released (ii). The expression levels of ERV mRNA also depend on the signalling context. The ERV families with the binding sites for Elk/Ets/AP1 are expressed at higher levels in the presence of Elk/Ets/AP1, similar to RLTR6-int. el,n, Each dot indicates an independent biological sample. The error bars indicate the s.e.m. The P values were calculated using an unpaired two-tailed Student’s t-test, except for the two of the panels in Fig. 5l (P = 0.02 and 0.03), and have been indicated on the graphs. NS, not significant; WT, wild type. Numerical source data are provided.
Fig. 6 |
Fig. 6 |. ERVs in the H3K9me3-reduced regions as potential enhancers to regulate survival genes.
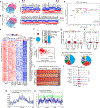
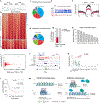
a,b, Histograms (a) and heatmaps (b) of the H3K9me3 densities for H3K9me3-decreased and -increased regions in BKO and DKO HSPCs (false-detection rate (FDR) < 0.01, FC > 1.6). c,d, Genome-wide distribution of H3K9me3-decreased (c) and -increased (d) peaks. e, Example of H3K9me3-reduced mountains. f, Histogram of the H3K9me3-reduced mountains in BKO and DKO HSPCs on day 14 after H3.3A deletion. TES, transcription end site. g, Percentage of ERVs at the distal and proximal loci within the H3K9me3-reduced regions. Distal peaks, distance to TSS of >1,000 bp. Proximal regions, distance to TSS of <1,000 bp. h, Motif analysis of ERV-overlapped distal H3K9me3-reduced regions. i, Fold change in mRNA levels in DKO LKS cells compared with BKO LKS cells plotted against the distance of the ERV to its TSS. Blue line, Log2(DKO/BKO) = 0.85 or −0.85. j, Integrative Genomics Viewer view of the promoter and enhancer regions for Il3ra showing the reduced H3K9me3 enrichment upstream of its TSS, the ERV elements and the putative binding sites for the transcription factors Irf4 and Myc near the H3K9me3-reduced region. Terra, telomeric repeat-containing RNA. Terra has been shown to serve as an epigenomic modulator in trans and regulate the telomerase function in cis. The Terra binding site is shown here as a reference. CHIRT, chromatin isolation of RNA targets. k, Expression levels of IL3RA in AML, normal haematopoietic progenitor and normal differentiated lineage cells. Each dot represents an independent biological sample. Mono, monocyte; MEP, megakaryocyte erythroid progenitor; MY, myeloid; BC, B cell. The P values were calculated using an unpaired two-tailed Student’s t-test; *P < 0.05, **P < 0.01 and ***P < 0.001. l, Kaplan–Meier survival curve of patients with AML stratified into two groups—that is, individuals with IL3RA expression levels above or below the median. m, Working model. (i) H3.3 maintains adult HSC homeostasis and prevents premature myeloid differentiation by regulating H3K27me3 and H3K9me3 enrichment. After H3.3A deletion, the reduction in H3K9me3 promotes transcription-factor binding and enhanced mRNA expression of target genes, conferring adapted survival for H3.3-null cells (right). (ii) For stemness genes and lineage-differentiation genes (RBCs), H3.3 prevents H3K27me3 enrichment at their promoter regions. H3.3 represses gene expression via H3K9me3 enrichment. After H3.3 deletion, the deposition of canonical histones H3.1 and H3.2 is unaffected (right). H3.2 and H3.1 are most probably deposited into the H3.3-null nucleosomes. Numerical source data are provided.

Comment in

Similar articles

Cited by

References

    1. Yu VWC et al. Epigenetic memory underlies cell-autonomous heterogeneous behavior of hematopoietic stem cells. Cell 167, 1310–1322 (2016). - PubMed
    1. Yu X et al. Chromatin dynamics during the differentiation of long-term hematopoietic stem cells to multipotent progenitors. Blood Adv 1, 887–898 (2017). - PMC - PubMed
    1. Lara-Astiaso D et al. Chromatin state dynamics during blood formation. Science 345, 943–949 (2014). - PMC - PubMed
    1. Corces MR et al. Lineage-specific and single-cell chromatin accessibility charts human hematopoiesis and leukemia evolution. Nat. Genet 48, 1193–1203 (2016). - PMC - PubMed
    1. Goldberg AD et al. Distinct factors control histone variant H3.3 localization at specific genomic regions. Cell 140, 678–691 (2010). - PMC - PubMed

Publication types

MeSH terms