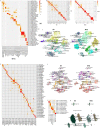
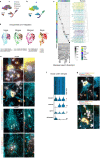
iBet uBet web content aggregator. Adding the entire web to your favor.


Link to original content: http://pubmed.ncbi.nlm.nih.gov/34616062/
Comparative cellular analysis of motor cortex in human, marmoset and mouse - PubMed Skip to main page content
U.S. flag

An official website of the United States government

Dot gov

The .gov means it’s official.
Federal government websites often end in .gov or .mil. Before sharing sensitive information, make sure you’re on a federal government site.

Https

The site is secure.
The https:// ensures that you are connecting to the official website and that any information you provide is encrypted and transmitted securely.

Access keys NCBI Homepage MyNCBI Homepage Main Content Main Navigation
Comparative Study
. 2021 Oct;598(7879):111-119.
doi: 10.1038/s41586-021-03465-8. Epub 2021 Oct 6.

Comparative cellular analysis of motor cortex in human, marmoset and mouse

Trygve E Bakken  1 Nikolas L Jorstad  2 Qiwen Hu  3 Blue B Lake  4 Wei Tian  5 Brian E Kalmbach  2   6 Megan Crow  7 Rebecca D Hodge  2 Fenna M Krienen  8 Staci A Sorensen  2 Jeroen Eggermont  9 Zizhen Yao  2 Brian D Aevermann  10 Andrew I Aldridge  11 Anna Bartlett  11 Darren Bertagnolli  2 Tamara Casper  2 Rosa G Castanon  11 Kirsten Crichton  2 Tanya L Daigle  2 Rachel Dalley  2 Nick Dee  2 Nikolai Dembrow  6   12 Dinh Diep  4 Song-Lin Ding  2 Weixiu Dong  4 Rongxin Fang  13 Stephan Fischer  7 Melissa Goldman  8 Jeff Goldy  2 Lucas T Graybuck  2 Brian R Herb  14 Xiaomeng Hou  15 Jayaram Kancherla  16 Matthew Kroll  2 Kanan Lathia  2 Baldur van Lew  9 Yang Eric Li  15   17 Christine S Liu  18   19 Hanqing Liu  11 Jacinta D Lucero  5 Anup Mahurkar  14 Delissa McMillen  2 Jeremy A Miller  2 Marmar Moussa  20 Joseph R Nery  11 Philip R Nicovich  2 Sheng-Yong Niu  11   21 Joshua Orvis  14 Julia K Osteen  5 Scott Owen  2 Carter R Palmer  18   19 Thanh Pham  2 Nongluk Plongthongkum  4 Olivier Poirion  15 Nora M Reed  8 Christine Rimorin  2 Angeline Rivkin  5 William J Romanow  18 Adriana E Sedeño-Cortés  2 Kimberly Siletti  22 Saroja Somasundaram  2 Josef Sulc  2 Michael Tieu  2 Amy Torkelson  2 Herman Tung  2 Xinxin Wang  23 Fangming Xie  24 Anna Marie Yanny  2 Renee Zhang  10 Seth A Ament  14 M Margarita Behrens  5 Hector Corrada Bravo  16 Jerold Chun  18 Alexander Dobin  25 Jesse Gillis  7 Ronna Hertzano  26 Patrick R Hof  27 Thomas Höllt  28 Gregory D Horwitz  29 C Dirk Keene  30 Peter V Kharchenko  3 Andrew L Ko  31   32 Boudewijn P Lelieveldt  9   33 Chongyuan Luo  34 Eran A Mukamel  35 António Pinto-Duarte  5 Sebastian Preissl  15 Aviv Regev  36 Bing Ren  15   17 Richard H Scheuermann  10   37   38 Kimberly Smith  2 William J Spain  6   12 Owen R White  14 Christof Koch  2 Michael Hawrylycz  2 Bosiljka Tasic  2 Evan Z Macosko  36 Steven A McCarroll  8   36 Jonathan T Ting  2   6 Hongkui Zeng  2 Kun Zhang  4 Guoping Feng  39   40   41 Joseph R Ecker  11   42 Sten Linnarsson  22 Ed S Lein  43
Affiliations
Comparative Study

Comparative cellular analysis of motor cortex in human, marmoset and mouse

Trygve E Bakken et al. Nature. 2021 Oct.

Erratum in

  • Author Correction: Comparative cellular analysis of motor cortex in human, marmoset and mouse.
    Bakken TE, Jorstad NL, Hu Q, Lake BB, Tian W, Kalmbach BE, Crow M, Hodge RD, Krienen FM, Sorensen SA, Eggermont J, Yao Z, Aevermann BD, Aldridge AI, Bartlett A, Bertagnolli D, Casper T, Castanon RG, Crichton K, Daigle TL, Dalley R, Dee N, Dembrow N, Diep D, Ding SL, Dong W, Fang R, Fischer S, Goldman M, Goldy J, Graybuck LT, Herb BR, Hou X, Kancherla J, Kroll M, Lathia K, van Lew B, Li YE, Liu CS, Liu H, Lucero JD, Mahurkar A, McMillen D, Miller JA, Moussa M, Nery JR, Nicovich PR, Niu SY, Orvis J, Osteen JK, Owen S, Palmer CR, Pham T, Plongthongkum N, Poirion O, Reed NM, Rimorin C, Rivkin A, Romanow WJ, Sedeño-Cortés AE, Siletti K, Somasundaram S, Sulc J, Tieu M, Torkelson A, Tung H, Wang X, Xie F, Yanny AM, Zhang R, Ament SA, Behrens MM, Bravo HC, Chun J, Dobin A, Gillis J, Hertzano R, Hof PR, Höllt T, Horwitz GD, Keene CD, Kharchenko PV, Ko AL, Lelieveldt BP, Luo C, Mukamel EA, Pinto-Duarte A, Preiss S, Regev A, Ren B, Scheuermann RH, Smith K, Spain WJ, White OR, Koch C, Hawrylycz M, Tasic B, Macosko EZ, McCarroll SA, Ting JT, Zeng H, Zhang K, Feng G, Ecker JR, Linnarsson S, Lein ES. Bakken TE, et al. Nature. 2022 Apr;604(7904):E8. doi: 10.1038/s41586-022-04562-y. Nature. 2022. PMID: 35319013 Free PMC article. No abstract available.

Abstract

The primary motor cortex (M1) is essential for voluntary fine-motor control and is functionally conserved across mammals1. Here, using high-throughput transcriptomic and epigenomic profiling of more than 450,000 single nuclei in humans, marmoset monkeys and mice, we demonstrate a broadly conserved cellular makeup of this region, with similarities that mirror evolutionary distance and are consistent between the transcriptome and epigenome. The core conserved molecular identities of neuronal and non-neuronal cell types allow us to generate a cross-species consensus classification of cell types, and to infer conserved properties of cell types across species. Despite the overall conservation, however, many species-dependent specializations are apparent, including differences in cell-type proportions, gene expression, DNA methylation and chromatin state. Few cell-type marker genes are conserved across species, revealing a short list of candidate genes and regulatory mechanisms that are responsible for conserved features of homologous cell types, such as the GABAergic chandelier cells. This consensus transcriptomic classification allows us to use patch-seq (a combination of whole-cell patch-clamp recordings, RNA sequencing and morphological characterization) to identify corticospinal Betz cells from layer 5 in non-human primates and humans, and to characterize their highly specialized physiology and anatomy. These findings highlight the robust molecular underpinnings of cell-type diversity in M1 across mammals, and point to the genes and regulatory pathways responsible for the functional identity of cell types and their species-specific adaptations.


Conflict of interest statement

A.Re. is an equity holder and founder of Celsius Therapeutics, a founder of Immunitas, and a member of the Scientific Advisory Board at Syros Pharmaceuticals, Neogene Therapeutics, Asimov and Thermo Fisher Scientific. B.R. is a shareholder of Arima Genomics, Inc. K.Z. is a co-founder and equity holder and serves on the Scientific Advisory Board of Singlera Genomics. P.V.K. serves on the Scientific Advisory Board to Celsius Therapeutics Inc.

Figures
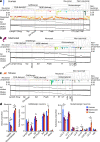
Fig. 1
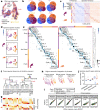
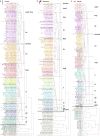
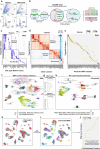
Fig. 1. Molecular taxonomy of cell types in the primary motor cortex (M1) of humans, marmosets and mice.
ac, Dendrograms showing cell-type clusters defined by RNA sequencing (RNA-seq; using Cv3) for humans (a), marmosets (b) and mice (c), annotated with the cluster proportions of total neuronal or non-neuronal cells and (for humans) with dissected layers (L1–L6). RNA-seq clusters mapped to clusters of accessible chromatin (AC) and DNAm. d, Relative proportions of some neuronal cell types were significantly different between species, based on analysis of variance (ANOVA) followed by Tukey’s HSD two-sided tests (degrees of freedom = 13; *P < 0.05 (Bonferonni-corrected)). Data in d are means ± s.d., and points represent individual donor specimens for humans (n = 2), marmosets (n = 2), and mice (n = 12). Marmoset silhouettes are from www.phylopic.org (public domain).
Fig. 2
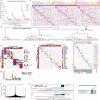
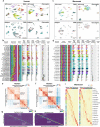
Fig. 2. Homology of GABAergic neurons across species.
a, Uniform manifold approximation and projection (UMAP) dimensional reduction of integrated snRNA-seq data. b, Venn diagrams showing subclass DEGs shared across species. c, Heat map showing expression of conserved and species-enriched DEGs. d, UMAP from a, separated by species and coloured by within-species clusters. e, Proportion of nuclei that overlap between human (rows, ordered as in Fig. 1a) and marmoset or mouse clusters in the integrated space. Asterisks mark the Meis2 subclass. f, Dendrogram showing consensus clusters of GABAergic neurons, with branches coloured by species mixture (grey, well mixed). g, Consensus cluster layers in humans (top) and mice (bottom). h, Dendrograms showing pairwise species integrations, coloured by subclass. i, Average classification performance (chance = 0.5) of gene sets for cell types within and between species. Linear regression fits are shown with black lines (slope at top left). j, Proportions of isoforms with a change in usage between species (humans, n = 15; mice, n = 15 cell subclasses). Box plots extend from 25th to 75th percentiles; central lines represent median value; whiskers extend to 1.5 times the interquartile interval.
Fig. 3
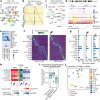
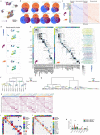
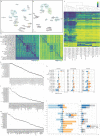
Fig. 3. Epigenomic profiling reveals gene-regulatory processes that define M1 cell types.
a, UMAP showing human M1 SNARE–seq2 data, labelled by cell subclass and AC cluster (colours). Astro, astrocyte; Car3, CAR3 gene; CT, corticothalamic cell; ET, extratelencephalic cell; IT, intratelencephalic cell; micro, microglia; NP, near-projecting; oligo, oligodendrocyte; OPC, oligodendrocyte precursor; PVM, perivascular macrophage. b, Heat maps showing the expression of markers of AC clusters and associated DARs. c, UMAP showing DNAm data from human M1, labelled by subclass and cluster (colour). d, Human genome tracks, showing AC and the hypomethylation (mCG) of DNA (DNAm) near KIT selectively in consensus cluster Lamp5_2. Co-accessible chromatin regions were identified by Cicero. e, Number of cell types identified for each technology and species varies across subclasses. f, Heat maps showing the activity of human and marmoset subclass DARs (K, thousands). g, Barplots showing the relative lengths of hypomethylated DMRs for subclasses across species, normalized by cytosine coverage genome-wide. Total DMRs are shown at the bottom. h, Left, conserved enrichment of transcription-factor motifs in DMRs (DNAm); TFBS activities in AC (using chromVAR); and expression of transcription factors, for Lamp5 neurons. CPM, counts per million; FP, false positive; TP, true positive. i, Correlations of cell subclasses (n = 13) between species for SNARE–Seq2 TFBS activities and expression of transcription factors and markers. Box plots extend from 25th to 75th percentiles; central lines represent medians; whiskers extend over 1.5 times the interquartile interval. j, t-distributed stochastic neighbour embedding (t-SNE) plot showing enrichment of TFBSs in DMRs.
Fig. 4
Fig. 4. L4-like neurons in M1.
a, L4 is present in human MTG not M1, on the basis of cytoarchitecture in Nissl-stained sections. b, t-SNE plot of integrated snRNA-seq from M1 and MTG glutamatergic neurons. c, Nuclei annotated on the basis of the relative depth of the dissected layer and within-area cluster. Two clusters from superficial layers are labelled (red dotted outline). d, Estimated relative depth from pia (mean ± s.d.) of M1 glutamatergic clusters (n = 44) and closest matching MTG neurons. Approximate layer boundaries are indicated (grey lines). e, Magnified view of L4-like clusters in M1 and MTG. f, Overlap of M1 and MTG clusters in integrated space identifies homologous and MTG-specific clusters. g, Multicolour FISH (mFISH) quantifies differences in layer distributions for homologous types between M1 and MTG. Cells (red dots) in each cluster were labelled using the markers listed below each representative inverted image of a DAPI-stained cortical column. DAPI, 4′,6-diamidino-2-phenylindole. h, ISH-estimated frequencies (mean ± s.d.) of homologous clusters (ESR1, n = 3; LINC01202, n = 4; COL22A1, n = 3; OTOGL, n = 3 samples).
Fig. 5
Fig. 5. Chandelier neurons have a core set of conserved molecular features.
a, Representative ultrastructural reconstructions of ChCs and basket cells (BCs) across species. Scale bars, 100 μm. Insets show higher magnifications of unique ChC synapse specializations, axon cartridges. b, Venn diagram showing ChC-enriched DEGs shared across species. c, Scatter plots showing BC and ChC expression of all genes (grey), all transcription factors (cyan) and conserved ChC markers (non-transcription factors, red; transcription factors, magenta) for each species. d, Dot plots showing the enrichment of transcription-factor (TF) motifs in genome-wide mCG DMRs and hypomethylation of transcription-factor gene bodies (mCH) for BCs and ChCs across species. FC, fold change. e, Dot plot showing TFBS activities in AC for BCs and ChCs across species.
Fig. 6
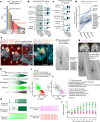
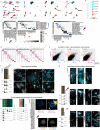
Fig. 6. Betz cells have specialized molecular and physiological properties.
a, Upset plot showing marker genes of L5 ET compared with L5 IT across species. b, c, Violin plots showing expression of genes related to ion channels for genes (proteins) that are enriched in ET versus IT neurons (b) and in primate versus mouse ET neurons (c). d, Genes with decreasing enrichment in L5 ET versus IT neurons with evolutionary distance from humans. e, Example photomicrographs of ISH-labelled, SMI-32-immunofluorescence-stained cells with Betz-like morphology in human M1 L5. Cell types are identified on the basis of marker genes. Insets show higher magnification of ISH in corresponding cells. Asterisks mark lipofuscin; main panels, scale bars, 25 μm, inset scale bars, 10 μm. f, Exemplar biocytin fills of L5 ET neurons (macaque, n = 1; mice, n = 10; humans, n = 3) with transcriptomic, morphological and electrophysiological measurements in brain slices. Scale bars, 200 μm. g, Magnetic resonance images of sagittal and coronal planes, showing the approximate location of excised premotor cortex tissue (yellow lines) and adjacent M1. h, Voltage responses to a chirp stimulus for the neurons shown in f, g (left neuron in g). i, j, Neurons were grouped into putative ET (humans, n = 6; macaques, n = 14; mice, n = 136) versus non-ET (humans, n = 2; macaques, n = 28; mice, n = 175) neurons on the basis of resonant frequency (RN) and input resistance (fR). k, Example voltage responses to current injections (10-s step) for ET and non-ET neurons. The amplitude was adjusted to produce roughly five spikes during the first second. l, Firing rate (mean ± s.e.m.) for 1-s epochs during the current injection. The firing rates of primate ET neurons (pooled data from humans and macaques, n = 20) decreased and then increased, whereas the firing rates of other neurons (primate IT neurons, n = 30; mouse ET neurons, n = 8; mouse IT neurons, n = 12) increased or remained constant.
Extended Data Fig. 1
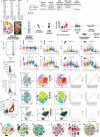
Extended Data Fig. 1. Metrics of RNA-seq quality and integration of human datasets.
a, Nissl-stained sections of M1, annotated with layers and showing the relative expansion of cortical thickness (particularly of L2 and L3 in primates) and large pyramidal neurons or ‘Betz’ cells in human L5 (black dotted outline, with high-magnification adjacent panel). Scale bars, 100 μm (low magnification), 20 μm (high magnification). M1 was identified in each species from its cortical location and histological features. b, Phylogeny of species; mya, millions of years ago. c, Number of nuclei included for analysis in each molecular assay. Numbers of donors are in parentheses; ‘p’ indicates pooled biological replicates. All assays used nuclei isolated from the same donors in humans and marmosets. 15,842 nuclei were also profiled from L5 in macaques (n = 3) using Cv3. d, Workflow showing the isolation of single nuclei from M1 of post-mortem human brain and profiling with RNA-seq. The black outline in the Nissl image highlights a cluster of Betz cells in L5. e, FACS gating scheme for sorting nuclei. f, Using SSv4, we sequenced more than one million total reads across all subclasses in humans. gi, Cv3 analysis shows that total unique molecular identifiers (UMIs) vary between subclasses, and that these differences are shared across species. For each subclass, single nuclei are plotted together with median values and interquartile intervals. jm, Gene detection (expression level greater than 0) is highest in human when using SSv4 (j) and lowest for marmosets when using Cv3 (l). Note that the average read depth used for SSv4 was approximately 20-fold greater than that for Cv3 (target 60,000 reads per nucleus). For each subclass, single nuclei plus medians and interquartile intervals are plotted. np, Integration of SSv4 and Cv3 RNA-seq datasets from human single nuclei isolated from GABAergic (n) and glutamatergic (o) neurons and non-neuronal cells (p). Left three panels, UMAP visualizations, coloured by RNA-seq technology, cell subclass, and unsupervised consensus clusters. Right two panels, confusion matrices show membership of SSv4 and Cv3 nuclei within 127 integrated consensus clusters. q, r, t-SNE projections of single nuclei, based on expression of several thousand genes with variable gene expression and coloured by cluster label (q) or donor (r). Clusters are well separated in all species, and nuclei from different donors are well mixed within clusters, with some donor-specific technical effects in marmosets.
Extended Data Fig. 2
Extended Data Fig. 2. Taxonomies of M1 cell types in humans, marmosets and mice.
ac, Taxonomies are reproduced from Fig. 1. Leaves are labelled with species-specific clusters, and branches are labelled with major subclasses of neuronal types. We defined 127 human clusters on the basis of Cv3 and SSv4 data, 94 marmoset clusters from Cv3 data, and 116 mouse clusters in a companion paper by integrating 7 RNA datasets. These apparent differences in cellular diversity are likely to be driven by sampling depth, data quality and statistical criteria. For example, more non-neuronal nuclei were sampled in mice (58,098) and marmosets (21,189) than in humans (4,005), and more non-neuronal types were identified in those species.
Extended Data Fig. 3
Extended Data Fig. 3. RNA-seq integration of GABAergic neurons across species.
a, Dot plot showing the proportion of species-enriched subclass marker genes (from Fig. 2c, d) that show log-transformed fold change (logFC) enrichment over the same subclass from the other two species. b, Dendrogram showing clusters of GABAergic (inhibitory) neurons from unsupervised clustering of integrated RNA-seq data from humans, marmosets and mice. The branch thickness indicates the relative number of nuclei, and the branch colour indicates species mixing (grey is well mixed). Major branches are labelled by subclass. The dendrogram in Fig. 2f was derived from this tree by pruning species-specific branches. c, Heat maps showing scaled expression of the top five marker genes for each GABAergic cross-species cluster, and five marker genes for Lamp5 and Sst clusters. Initial genes were identified by performing a Wilcox test of every integrated cluster against all other GABAergic nuclei. Additional DEGs were identified for Lamp5 and Sst cross-species clusters, by comparing one of the cross-species clusters with all other related nuclei (for example, Sst_1 against all other Sst clusters). d, e, Heat map showing ‘one versus best MetaNeighbour’ scores for GABAergic subclasses (d) and clusters (e). Each column shows the performance of a single training group across the three test datasets. AUROCs are computed between the two closest neighbours in the test dataset, where the closer neighbour will have the higher score, and all others are shown in grey (NA). For example, in d the first column contains results of training on human Lamp5, labelled with numbers to indicate test datasets, where 1 is human, 2 is marmoset and 3 is mouse, and letters to indicate closest (a) and second-closest (b) neighbouring groups. Dark red three-by-three blocks along the diagonal indicate high transcriptomic similarity across all three species. f, Heat map showing cluster overlaps obtained from pairwise human–marmoset Seurat integration, indicating the proportion of within-species clusters that coalesce within integrated clusters. Columns and rows are ordered as in Fig. 2e, with cross-species consensus clusters indicated by blue boxes. The top and left colour bars indicate subclasses of within-species clusters. g, Bar plots quantifying the number of well mixed leaf nodes (mean ± s.d.; n = 100 subsamples) in dendrograms of pairwise species integrations from Fig. 2h. ANOVA tests for each subclass were followed by two-sided Tukey’s HSD tests with Bonferroni correction for multiple comparisons; degrees of freedom = 297; *P < 0.0001. h, Histogram showing the relative difference in isoform genic proportion (P) between humans and mice for all subclass comparisons. All moderately to highly expressed isoforms were included (gene TPM greater than 10 in both species; isoform TPM greater than 10 and proportion greater than 0.2 in either species). Vertical lines indicate a more than ninefold change in mice or humans. i, Genome-browser tracks of RNA-seq (SSv4) reads in human and mouse L5/6 NP neurons at the CHN2 locus for the three most common isoforms. The short isoform of CHN2 is predominantly expressed in mouse neurons; longer isoforms are also expressed in human neurons.
Extended Data Fig. 4
Extended Data Fig. 4. Homology of glutamatergic neurons across species.
a, UMAP visualization of integrated snRNA-seq data from human, marmoset and mouse glutamatergic neurons. The highlighted colours indicate subclasses. b, Venn diagrams indicating the number of DEGs shared across species by subclass. DEGs were determined by ROC tests of a subclass against all other glutamatergic subclasses within a species. c, Heat map of conserved and species-enriched DEGs from b, ordered by subclass and species enrichment. The heat map shows expression, scaled by column, for up to 50 randomly sampled nuclei from each subclass for each species. d, UMAP visualization of integrated snRNA-seq data, with projected nuclei split by species. Colours indicate different within-species clusters. e, Cluster overlap heat map showing the proportion of nuclei in each pair of species clusters that are mixed in the cross-species integrated space. Cross-species consensus clusters are indicated by labelled blue boxes. The top and left axes indicate the subclass of a given within-species cluster by colour. The bottom axis indicates marmoset (left) and mouse (right) within-species clusters. The right axis shows the glutamatergic branch of the human dendrogram from Fig. 1a. f, Dendrogram showing cross-species clusters of glutamatergic neurons, with branches coloured by species mixture (grey, well mixed). g, Unpruned dendrogram of clusters of glutamatergic neurons, from unsupervised clustering of integrated RNA-seq data. The branch thickness indicates the relative number of nuclei, and the branch colour indicates species mixing. Major branches are labelled by subclass. h, Heat maps showing scaled expression of marker genes for each glutamatergic cross-species cluster. The top five marker genes for each cross-species cluster are shown, with an additional five genes for L5 extratelencephalic, L5 intratelencephalic and L6 intratelencephalic neurons. Initial genes were identified by performing a Wilcox test of every integrated cluster against all other glutamatergic nuclei. Additional DEGs were identified for L5 extratelencephalic, L5 intratelencephalic and L6 intratelencephalic cross-species clusters, by comparing one of the cross-species clusters with all other related nuclei (for example, L5 IT_1 against all other L5 IT neurons). i, j, Heat map of ‘one versus best MetaNeighbour’ scores for glutamatergic subclasses (i) and clusters (j). k, Bar plots quantifying the number of well mixed leaf nodes (mean ± s.d.; n = 100 subsamples) from unsupervised clustering of pairwise species integrations. ANOVA tests for each subclass were followed by two-sided Tukey’s HSD tests with Bonferroni correction for multiple comparisons; *P < 0.005.
Extended Data Fig. 5
Extended Data Fig. 5. Homology of non-neuronal cell types across species.
a, UMAP plots of integrated RNA-seq data for non-neuronal nuclei, coloured by species and within-species clusters. Note that some cell types are present in only one or two species. b, UMAP plot showing maturation lineage between oligodendrocyte precursor cells (OPCs) and oligodendrocytes on the basis of reported marker genes; this lineage was present in mice but not primates, probably reflecting the younger age of mouse tissues used. c, Heat maps showing the proportion of nuclei in each species-specific cluster that overlap in the integrated clusters. Blue boxes define homologous cell types that can be resolved across all three species. Arrows highlight clusters that overlap between two species and are not detected in the third species, owing to differences in the sampling depth of non-neuronal cells, the relative abundances of cell types between species, or evolutionary divergence. Pericytes, smooth muscle cells (SMCs) and some subtypes of vascular and leptomeningeal cells (VLMCs) were present in marmoset and mouse and not human datasets, although these cells are present in human cortex. Mitotic astrocytes (Astro_Top2a) were present in mice only, and represented 0.1% of non-neuronal cells. d, Conserved marker genes from homologous cell types across species. e, Pairwise comparisons between species of log-transformed gene expression (counts per 100,000 transcripts) of the Astro_1 type. Coloured points correspond to significantly differentially expressed genes (FDR less than 0.01; log-transformed fold change greater than 2). r, Spearman correlation. f, Validation of fibrous astrocytes in situ. Violin plots show marker genes from clusters of human astrocytes that correspond to fibrous, interlaminar and protoplasmic types on the basis of in situ labelling of types. Left ISH images show fibrous astrocytes located in the white matter (WM, top), and a subset of L1 astrocytes (bottom) that express the Astro L1-6 FGFR3 AQP1 marker gene TNC. The centre ISH image shows a putative varicose projection astrocyte located in cortical L5 adjacent to a blood vessel (bv) and extending long processes labelled with glial fibrillary acidic protein (GFAP; white arrows); this astrocyte does not express the marker gene TNC. The white dashed box indicates the area shown at higher magnification in the top right panel. Likewise, the L3 protoplasmic astrocyte shown in the bottom right panel does not express TNC. Scale bars, 15 μm. g, Combined GFAP immunohistochemistry and RNAscope FISH for markers of L1 astrocytes in humans, mice and marmosets. In humans (top panels), pial and subpial interlaminar astrocytes are labelled with AQP4 and ID3 and extend long processes from L1 down to L3. In marmosets (centre panels), both pial and subpial L1 astrocytes express AQP4 and GRIK2 and extend GFAP-labelled processes through L1 that terminate before reaching L2. An image of a marmoset protoplasmic astrocyte located in L3 (top right) shows that this astrocyte type does not express the marker gene GRIK2. A subset of marmoset fibrous astrocytes located in the white matter (bottom right) express GRIK2, suggesting that fibrous and L1 astrocytes have a shared gene-expression signature, as also seen in humans. L1 astrocytes in mice (bottom panels) consist of pial and subpial types that differ morphologically but are characterized by their expression of the genes Aqp4 and Id3. Pial astrocytes in mice extend short GFAP-labelled processes that terminate within L1, whereas subpial astrocytes appear to extend processes predominantly towards the pial surface. Protoplasmic astrocytes (an example is shown in L5) do not express Id3, whereas fibrous astrocytes share expression of Id3 with L1 astrocyte types. In each image, a higher magnification of the cell is shown in white dashed boxes to demonstrate RNAscope spots for each gene labelled. Scale bars, 20 μm. h, Violin plots showing marker genes from clusters of oligodendrocyte lineages in humans. Transcripts detected in the Oligo L2−6 OPALIN MAP6D1 cluster include genes that are expressed almost exclusively in neuronal cells. i, Left, Inverted DAPI image showing a column of cortex labelled with markers of the human Oligo L2-6 OPALIN MAP6D1 type. Red dots show cells triple labelled for SOX10, NPTX1 and ST18. Top right, examples of cells labelled with combinations of marker genes specific for the human Oligo L2-6 OPALIN MAP6D1 type. Bottom right, example of a marmoset cell labelled with the marker genes OLIG2 and NRXN3. Scale bars, 20 μm.
Extended Data Fig. 6
Extended Data Fig. 6. SNARE–seq2 transcriptomic profiling resolves M1 cell types.
a, b, FACS gating parameters used for sorting human and marmoset single nuclei (a) and for SNARE–seq2 (b), to generate libraries of RNA and accessible chromatin (AC) that have the same cell barcodes (BC). gDNA, guide DNA. c, Dot plot showing averaged values for the expression of marker genes (blue shading; log scale) and the proportion of nuclei with expression (black circles) for clusters identified from analysis of SNARE–seq2 RNA using Pagoda2. d, Correlation heat map of averaged scaled gene-expression values for Pagoda2 clusters against SSv4 clusters from the same M1 region. e, Jaccard similarity plot for cell barcodes grouped according to Pagoda2 clustering and compared against the predicted SSv4 clustering. fk, Overview of cluster assignments at the level of accessible chromatin using RNA-defined clusters, indicating the five main steps of the process. f, RNA clusters visualized by UMAP on RNA expression data, which were used to independently call peaks from data on accessible chromatin. g, Histograms showing maximum prediction scores for RNA cluster (top) and subclass (bottom) labels from RNA data to corresponding accessibility data (Cicero gene activities). h, Peak regions called from barcode groupings at the level of RNA cluster, subclass and class were combined, and the corresponding peak by cell barcode matrix was used to predict gene-activity scores by using Cicero for integrative analyses of RNA and accessible chromatin. The UMAP shows joint embedding of RNA and imputed AC expression values using Seurat/Signac. i, UMAP showing clusters identified from the joint embedding (h). j, Jaccard similarity plot comparing cell barcodes grouped either according to RNA clustering or by joint clustering of RNA and accessible chromatin (i). RNA clusters were merged to best match the cluster resolution achieved from co-embedded clusters. Chromatin peak counts generated from peak calling on barcode groupings from RNA, accessible chromatin, subclass and class were used to generate a final peak by cell barcode matrix. k, Final clusters at the level of accessible chromatin visualized using UMAP.
Extended Data Fig. 7
Extended Data Fig. 7. SNARE–seq2 quality statistics.
a, UMAP plots showing human clusters at the level of accessible chromatin and corresponding participant identities for both RNA and chromatin embeddings. b, Bar, violin and box plots for human AC-level clusters, showing the proportion contributed by each experiment or patient, mean UMI and genes detected from the RNA data, the mean peaks and Cicero active genes detected from AC data, the fraction of reads found in promoters for AC data, and the number of nuclei making up each of the clusters. Box plots extend from 25th to 75th percentiles; central lines represent medians; and whiskers extend up to 1.5 times the interquartile interval. c, UMAP plots showing marmoset AC-level clusters and corresponding subject identities for both RNA and chromatin embeddings. d, Bar, violin and box plots for marmoset AC-level clusters, showing the proportion contributed by each library or subject, mean UMI and genes detected from the RNA data, the mean peaks and cicero active genes detected from AC data, the fraction of reads found in promoters for AC data, and the number of nuclei making up each of the clusters. Box plots extend from 25th to 75th percentiles; central lines represent medians; and whiskers extend up to 1.5 times the interquartile interval. e, f, Correlation heat maps of average scaled gene-expression values against average scaled Cicero gene activity values for RNA clusters (e) and AC-level clusters (f). g, h, Heat maps showing top averaged scaled chromatin accessibility values for DARs (Supplementary Table 14) identified for clusters at the level of RNA (g) and accessible chromatin (f). i, Heat maps showing the expression of marmoset AC-cluster markers and associated DARs, as shown for humans in Fig. 3b.
Extended Data Fig. 8
Extended Data Fig. 8. Cell types identified by DNA methylation and integration with RNA-seq data.
a, b, UMAP visualizations of marmoset (a) and mouse (b) data on DNA methylation (snmC-seq2) and cell clusters. c, Cell-type DMRs (mCG) across human neuronal clusters. Only those DMRs with at least 20 differentially methylated cytosine sites are shown. d, Hypomethylation of CG (left) and CH (right) in the gene bodies of cluster markers in humans. eg, Mapping between DNAm-seq and RNA-seq clusters from humans (e), marmosets (f) and mice (g). The numbers of nuclei in each cluster are listed in parentheses. h, Barplots showing the relative lengths of hypomethylated and hypermethylated DMRs among cell subclasses across three species, normalized by genome-wide cytosine coverage (see Methods). The total numbers of DMRs for each subclass are listed (k, thousands). i, Numbers of hypomethylated and hypermethylated DMRs and overlap with chromatin accessible peaks in each subclass of human. j, Numbers of AC peaks and overlap with DMRs in each subclass in humans.
Extended Data Fig. 9
Extended Data Fig. 9. Analysis of TFBS enrichment on hypomethylated DMRs shows that gene regulation is distinct across subclasses and conserved across species.
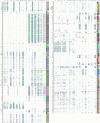
Analyses of the enrichment of TFBS motifs were conducted using JASPAR’s non-redundant core vertebrate transcription-factor motifs for neuronal subclasses in each species. Each subclass tri-column shows, from left to right, the results from humans, marmosets and mice. The size of a dot denotes the P value of the corresponding motif, while the colour denotes the fold change. The rightmost two columns show clusters of transcription factors (cl) identified from motif profiles and families of transcription factors (fam) identified from the structures of transcription factors as defined in the JASPAR database.
Extended Data Fig. 10
Extended Data Fig. 10. Homologies of cell types in human cortical areas based on RNA-seq integration.
a, Heat map showing the overlap of clusters of glutamatergic neurons between M1 and MTG. Interestingly, four MTG L2/3 intratelencephalic types (LTK, GLP2R, FREM3 and CARM1P1) with distinct physiology and morphology had less clear homology in M1, indicating more areal variation in supragranular neurons. b, Heat maps showing the overlap of clusters of glutamatergic neurons for M1 and MTG test datasets. Clusters were split in half, and the two datasets were integrated using the same analysis pipeline as for the M1 and MTG integration. Most clusters mapped correctly (along the diagonal) with some loss in resolution between closely related clusters (red blocks). c, t-SNE plots of integrated glutamatergic neurons labelled with M1 and MTG clusters. dg, Heat maps of cluster overlaps and t-SNE plots of integrations for GABAergic neurons (d, e) and non-neuronal cells (f, g), as described in ac for glutamatergic neurons.
Extended Data Fig. 11
Extended Data Fig. 11. Cross-species alignment of L5 glutamatergic neurons, and conservation and divergence of transcriptomic properties.
a, b, UMAP visualizations of cross-species integration of snRNA-seq data for glutamatergic neurons isolated from humans, macaques (L5 dissection only), marmosets and mice. Colours indicate species (a) or cell subclass (b). c, Heat map of cluster overlaps, showing the proportion of nuclei from within-species clusters that are mixed within the same integrated clusters. Human clusters (rows) are ordered according to the dendrogram reproduced from Fig. 1a. Macaque clusters (columns) are ordered to align with human clusters. Colour bars at the top and left indicate subclasses of within-species clusters. The blue outline denotes the L5 extratelencephalic subclass. d, UMAP visualizations of cross-species integration of L5 extratelencephalic neurons. There is good correspondence across species to the mouse L5 ET_1 subtype that projects to medulla. e, Examples of cells labelled by ISH and stained with anti-SMI-32 immunofluorescence in L5 of human and mouse M1. Cells are labelled with the extratelencephalic marker POU3F1/Pou3f1 and the ion-channel genes CACNA1C/Cacna1c or KCNC2/Kcnc2. Consistent with snRNA-seq data, human L5 extratelencephalic M1 neurons appear to express higher levels of CACNA1C and KCNC2 than do mouse L5 extratelencephalic M1 neurons. Scale bars, main images, 25 μm (humans), 15 μm (mice); insets, 10 μm (humans), 5 μm (mice). f, Violin plot showing the expression of marker genes for subtypes of human L5 extratelencephalic neurons. g, Two examples of cells with Betz morphology, labelled by ISH and stained with anti-SMI-32 immunofluorescence, in L5 of human M1 that correspond to the L5 extratelencephalic clusters Exc L3-5 FEZF2 ASGR2 and EXC L5 CSN1S1. Insets show higher magnification of ISH-labelled transcripts in corresponding cells. Scale bars, 25 μm, insets 10 μm. Asterisks mark lipofuscin.
Extended Data Fig. 12
Extended Data Fig. 12. Differences in spike trains produced by L5 glutamatergic neurons and single spike properties across species.
a, Example IR-DIC (left) and fluorescence (right) images obtained from a macaque organotypic slice culture. Note the inability to visualize the fluorescently labelled neurons in IR-DIC because of dense myelination. All human and macaque recordings were from labelled neurons. Scale bar, 50 μm. b, Patch–seq involves the collection of morphological, physiological and transcriptomic data from the same neuron. Following electrophysiological recording and cell filling with biocytin via whole-cell patch clamp, the contents of the cell are aspirated and processed for RNA sequencing. This permits a transcriptomic cell type to be pinned to the physiologically probed neuron. c, Top, example ZAP profiles for the neurons shown in Fig. 6f–h. Bottom, cumulative probability distribution showing input resistance for physiologically defined L5 neuron types from primates versus mice. *P = 0.0064, Kolmogorov–Smirnov test between mouse and primate extratelencephalic neurons. d, Raster plot of spike times during 1-s epochs of a 10-s injection of DC current, with colour coding as in c. Primate extratelencephalic neurons (pooled data from humans and macaques, n = 20) displayed a distinctive decrease followed by a pronounced increase in firing rate over the course of the current injection, whereas other neuron types did not (primate intratelencephalic neurons, n = 30; mouse extratelencephalic neurons, n = 8; mouse intratelencephalic neurons, n = 12). Notably, a similar biphasic-firing pattern is observed in macaque corticospinal neurons in vivo during prolonged motor movements,, suggesting that the firing pattern of these neurons during behaviour is intimately tied to their intrinsic membrane properties. The acceleration in spike times of rodent extratelencephalic neurons has been attributed to the expression of Kv1-containing voltage-gated K+ channels, encoded by genes such as the conserved extratelencephalic gene KCNA1 (ref.). e, Example voltage responses to a 1-s, 500-pA current injection. f, Action potentials (mean ± s.e.m.) as a function of the amplitude of injected current. Primate extratelencephalic neurons display the shallowest relationship between action potential and injected current, perhaps partially because of their exceptionally low input resistance (primate extratelencephalic neurons, n = 20; primate intratelencephalic neurons, n = 30; mouse extratelencephalic neurons, n = 9; mouse intratelencephalic neurons, n = 12). g, Voltage responses to a current injection with a 1-s, 3-nA step. h, Action potentials (mean ± s.e.m.) as a function of injected current for a subset of experiments in which the amplitude of injected current was increased incrementally to 3 nA. Although both mouse (n = 9) and primate (n = 10) extratelencephalic neurons could sustain high firing rates, primate neurons required 3 nA of current over 1 s to reach similar average firing rates as mouse extratelencephalic neurons. i, Example voltage responses to current injections with 1-s depolarizing steps. The amplitude of the current injection was adjusted to produce roughly ten spikes. Also shown are voltage responses to a hyperpolarizing current injection. j, The firing rate (mean ± s.e.m.) of primate extratelencephalic (n = 18), primate intratelencephalic (n = 30) and mouse intratelencephalic (n = 86) neurons decreased during the 1-s step current injection, whereas the firing rate of mouse extratelencephalic neurons increased (n = 110). The acceleration ratio is the ratio of the second to the last interspike interval. *P < 0.05, Bonferroni-corrected two-sided t-test. k, Example single action potentials (above) and phase plane plots (below). l, Various features of action potentials (mean ± s.e.m.) are plotted as a function of cell type (primate extratelencphalic, n = 20; primate intratelencephalic, n = 30; mouse extratelencephalic, n = 9; mouse intratelencephalic, n = 12). Notably, action potentials in primate extratelencephalic neurons were reminiscent of fast spiking interneurons, in that they were shorter and more symmetrical compared with action potentials in other neuron types/species. Intriguingly, the K+-channel subunits Kv3.1 and Kv3.2, which are implicated in fast-spiking physiology, are encoded by highly expressed genes (KCNC1 and KCNC2) in primate extratelencephalic neurons (Fig. 6c). *P < 0.05, Bonferroni-corrected two-sided t-test.

Comment in

Similar articles

Cited by

References

    1. Ebbesen CL, Brecht M. Motor cortex—to act or not to act? Nat. Rev. Neurosci. 2017;18:694–705. - PubMed
    1. Tasic B, et al. Shared and distinct transcriptomic cell types across neocortical areas. Nature. 2018;563:72–78. - PMC - PubMed
    1. Hodge RD, et al. Conserved cell types with divergent features in human versus mouse cortex. Nature. 2019;573:61–68. - PMC - PubMed
    1. Luo C, et al. Single-cell methylomes identify neuronal subtypes and regulatory elements in mammalian cortex. Science. 2017;357:600–604. - PMC - PubMed
    1. Yao, Z. et al. A transcriptomic and epigenomic cell atlas of the mouse primary motor cortex. Nature10.1038/s41586-021-03500-8 (2021). - PMC - PubMed

Publication types

MeSH terms