iBet uBet web content aggregator. Adding the entire web to your favor.


Link to original content: http://pubmed.ncbi.nlm.nih.gov/34539973/
A Robust Panel Based on Mitochondrial Localized Proteins for Prognostic Prediction of Lung Adenocarcinoma - PubMed Skip to main page content
U.S. flag

An official website of the United States government

Dot gov

The .gov means it’s official.
Federal government websites often end in .gov or .mil. Before sharing sensitive information, make sure you’re on a federal government site.

Https

The site is secure.
The https:// ensures that you are connecting to the official website and that any information you provide is encrypted and transmitted securely.

Access keys NCBI Homepage MyNCBI Homepage Main Content Main Navigation
. 2021 Sep 9:2021:7569168.
doi: 10.1155/2021/7569168. eCollection 2021.

A Robust Panel Based on Mitochondrial Localized Proteins for Prognostic Prediction of Lung Adenocarcinoma

Affiliations

A Robust Panel Based on Mitochondrial Localized Proteins for Prognostic Prediction of Lung Adenocarcinoma

Weifeng Chen et al. Oxid Med Cell Longev. .

Abstract

Due to high energy and material metabolism requirements, mitochondria are frequently active in tumor cells. Our study found that the high energy metabolism status is positively correlated with the poor prognosis of patients with lung adenocarcinoma. We constructed a scoring system (mitoRiskscore) based on the gene expression of specific mitochondrial localized proteins through univariate and LASSO cox regression. It has been shown that high mitoRiskscore was correlated with a shorter survival time after surgery in patients with lung adenocarcinoma. Compared with the typical TNM grading system, the mitoRiskscore gene panel had higher prediction accuracy. A vast number of external verification results ensured its universality. Additionally, the mitoRiskscore could evaluate the metabolic pattern and chemotherapy sensitivity of the tumor samples. Lung adenocarcinoma with higher mitoRiskscore was more active in glycolysis, and oxidative phosphorylation expression of proliferation-related pathway genes was also significantly upregulated. In contrast, patients with low mitoRiskscore had similar metabolic patterns to normal tissues. In order to improve the accuracy of prediction ability and promote clinical usage, we developed a nomogram that combined mitoRiskscore and clinical prognostic factors to predict the 3-year, 5-year, and 10-year survival rates of patients. We also performed in vitro experiments to verify the function of the key genes in the mitoRiskscore panel. In conclusion, the mitoRiskscore scoring system may assist clinicians to judge the postoperative survival rate and chemotherapy of patients with lung adenocarcinoma.


Conflict of interest statement

All authors declare no financial competing interests.

Figures

Figure 1
Figure 1
GSEA analyzes the difference in mitochondrial activity between lung adenocarcinoma and normal controls. Five gene sets related to mitochondrial activity from four GEO cohorts were analyzed. The curve above the enrichment score of 0 points indicates that the gene set is activated in lung adenocarcinoma. A curve below 0 points indicates that it is more active in the control group than in lung adenocarcinoma. p.adjust: adjusted p value; NES: normalized enrichment score.
Figure 2
Figure 2
Construction of the mitoRiskscore prediction panel. (a) The convergence of the LASSO cox regression coefficients. (b) A coefficient profile plot of the log (lambda) in the LASSO model. (c) The distribution of mitoRiskscore and the survival status of patients with different scores. (d) Heat map of the expression profiles of the mitoRiskscore gene panel. (e) Kaplan-Meier curves of overall survival for patients in high-risk group and low-risk group.
Figure 3
Figure 3
Verification of the independent prognostic value of the mitoRiskscore. (a) Forest plots of the univariate and multivariate Cox regression analyses among mitoRiskscore and clinical factors. (b) Time-dependent receiver operating characteristic curves at 1-year, 3-year, and 5year. AUC: Area Under Curve.
Figure 4
Figure 4
Results of external verification of mitoRiskscore using six microarray cohorts. Each cohort was equally divided into high- and low-risk group based on the value of mitoRiskscore. Kaplan-Meier analysis and time-dependent receiver operating characteristic curves of each cohort are displayed.
Figure 5
Figure 5
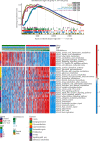
The mitochondrial activity and metabolic patterns of patients with different mitoRiskscore. (a) Enrichment plot of the five gene sets related to mitochondrial activity between the high- and low-risk groups in TCGA-LUAD using GSEA analysis. (b) Heat map showing the activation status of the biological processes in patients with different mitoRiskscore using GSVA analysis.
Figure 6
Figure 6
Differences in sensitivity of patients with different mitoRiskscore to chemotherapy. (a) The box plots of the estimated IC50 for commonly used chemotherapy drugs. (b) Correlation analysis between IC50 of two drugs and mitoRiskscore. p < 0.05, ∗∗p < 0.01, ∗∗∗p < 0.001, ∗∗∗∗p < 0.0001.
Figure 7
Figure 7
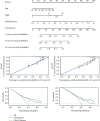
The establishment and verification of prognostic nomogram based on mitoRiskscore. (a) A nomogram for predicting 3-, 5-, and 10-year survival possibilities of individual LUAD patients. (b) Plots depict the calibration of the nomogram based on mitoRiskscore in terms of consistency between predicted and observed 3- and 5-year outcomes. (c) Decision curve analyses of the nomogram for 3- and 5-year risk.
Figure 8
Figure 8
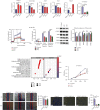
The regulation of the key genes in mitoRiskscore gene panel in the glycolysis metabolism, proliferation, and invasion of LUAD cells. (a) The expression of five genes in bronchial epithelial cell line (BEAS-2B) and lung adenocarcinoma cell lines (A549 and PC-9). (b) Knockdown efficiency of VDAC1 siRNA in A549 cell line. (c) Representative image and analysis of ECAR measurement in VDAC1 knockdown and control A549 cells. (d) Protein expression levels of LDHA, COXIV, SDHB, PGK1, and HKII in VDAC1 knockdown cells. (e) CCK-8 assays were used to evaluate A549 cell proliferation after VDAC1 knockdown. (f) GSEA analysis between patients with high and low expression of VDAC1. (g) The wound healing assay showed the migration ability of A549 cells after VADC1 knockdown. (h) Transwell experiments were performed to analyze the cell invasion ability after VDAC1 knockdown. p < 0.05, ∗∗p < 0.01, ∗∗∗p < 0.001, ∗∗∗∗p < 0.0001.

Similar articles

Cited by

References

    1. Bray F., Ferlay J., Soerjomataram I., Siegel R. L., Torre L. A., Jemal A. Global cancer statistics 2018: GLOBOCAN estimates of incidence and mortality worldwide for 36 cancers in 185 countries. CA: A Cancer Journal for Clinicians. 2018;68(6):394–424. doi: 10.3322/caac.21492. - DOI - PubMed
    1. Bade B. C., Dela Cruz C. S. Lung cancer 2020: epidemiology, etiology, and prevention. Clinics in Chest Medicine. 2020;41(1):1–24. doi: 10.1016/j.ccm.2019.10.001. - DOI - PubMed
    1. Duma N., Santana-Davila R., Molina J. R. Non-small cell lung cancer: epidemiology, screening, diagnosis, and treatment. Mayo Clinic Proceedings. 2019;94(8):1623–1640. doi: 10.1016/j.mayocp.2019.01.013. - DOI - PubMed
    1. Barta J. A., Powell C. A., Wisnivesky J. P. Global epidemiology of lung cancer. Annals of Medicine and Surgery. 2019;85(1) doi: 10.5334/aogh.2419. - DOI - PMC - PubMed
    1. Goldstraw P., Chansky K., Crowley J., et al. The IASLC lung cancer staging project: proposals for revision of the TNM stage groupings in the forthcoming (eighth) edition of the TNM classification for lung cancer. Journal of Thoracic Oncology. 2016;11(1):39–51. doi: 10.1016/j.jtho.2015.09.009. - DOI - PubMed

MeSH terms