iBet uBet web content aggregator. Adding the entire web to your favor.


Link to original content: http://pubmed.ncbi.nlm.nih.gov/34358845/
Leptin treatment prevents impaired hypoglycemic counterregulation induced by exposure to severe caloric restriction or exposure to recurrent hypoglycemia - PubMed Skip to main page content
U.S. flag

An official website of the United States government

Dot gov

The .gov means it’s official.
Federal government websites often end in .gov or .mil. Before sharing sensitive information, make sure you’re on a federal government site.

Https

The site is secure.
The https:// ensures that you are connecting to the official website and that any information you provide is encrypted and transmitted securely.

Access keys NCBI Homepage MyNCBI Homepage Main Content Main Navigation
. 2021 Nov:235:102853.
doi: 10.1016/j.autneu.2021.102853. Epub 2021 Jul 16.

Leptin treatment prevents impaired hypoglycemic counterregulation induced by exposure to severe caloric restriction or exposure to recurrent hypoglycemia

Affiliations

Leptin treatment prevents impaired hypoglycemic counterregulation induced by exposure to severe caloric restriction or exposure to recurrent hypoglycemia

Marina A DuVall et al. Auton Neurosci. 2021 Nov.

Abstract

Hypoglycemia-associated autonomic failure (HAAF) is a maladaptive failure in glucose counterregulation in persons with diabetes (PWD) that is caused by recurrent exposure to hypoglycemia. The adipokine leptin is known to regulate glucose homeostasis, and leptin levels fall following exposure to recurrent hypoglycemia. Yet, little is known regarding how reduced leptin levels influence glucose counterregulation, or if low leptin levels are involved in the development of HAAF. The purpose of this study was to determine the effect of hypoleptinemia on the neuroendocrine responses to hypoglycemia. We utilized two separate experimental paradigms known to induce a hypoleptinemic state: 60% caloric restriction (CR) in mice and three days of recurrent hypoglycemia (3dRH) in rats. A sub-set of animals were also treated with leptin (0.5-1.0 μg/g) during the CR or 3dRH periods. Neuroendocrine responses to hypoglycemia were assessed 60 min following an IP insulin injection on the terminal day of the paradigms. CR mice displayed defects in hypoglycemic counterregulation, indicated by significantly lower glucagon levels relative to controls, 13.5 pmol/L (SD 10.7) versus 64.7 pmol/L (SD 45) (p = 0.002). 3dRH rats displayed reduced epinephrine levels relative to controls, 1900 pg/mL (SD 1052) versus 3670 pg/mL (SD 780) (p = 0.030). Remarkably, leptin treatment during either paradigm completely reversed this effect by normalizing glucagon levels in CR mice, 78.0 pmol/L (SD 47.3) (p = 0.764), and epinephrine levels in 3dRH rats, 2910 pg/mL (SD 1680) (p = 0.522). These findings suggest that hypoleptinemia may be a key signaling event driving the development of HAAF and that leptin treatment may prevent the development of HAAF in PWD.

Keywords: Diabetes complications; Hypoglycemia; Leptin; Recurrent hypoglycemia; Starvation.


Conflict of interest statement

Disclosures:

The authors have stated explicitly that there are no conflicts of interest in connection with this article.

Figures
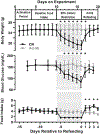
Figure 1.
Figure 1.. Six days of 60% caloric restriction leads to significant reductions in body weight and blood glucose while inducing hyperphagia and sustained reductions in blood glucose following refeeding.
Following a five day acclimation period and six days of baseline food intake data, wild type B6 male mice were assigned to either a 60% caloric restriction paradigm (CR mice; black circles) or ad libitum access to chow (Ad-lib mice; grey squares) for six days. Following the caloric restriction period, both groups of mice, CR and Ad-lib, were given ad libitum access to chow for four days (see top border for timing of each experimental period). CR mice experienced significant reductions in both body weight and blood glucose during the CR paradigm with both measurements reaching their nadir on the final day of the paradigm. The reduction in body weight was reversed within three days of refeeding, while blood glucose levels remained lower than those of Ad-lib mice only on the first day of refeeding. CR mice also displayed a marked hyperphagia during the refeeding period, which continued despite restoration of pre-restriction body weight. Data are expressed as mean ± SD. All data were analyzed via a two-way ANOVA with Bonferroni's multiple comparisons tests. Days marked with * represents significant differences between CR and Ad-lib groups (p-values < 0.05). n=52 per group days 1–17, n=35 per group days 18–19, and n=22 per group on day 20.
Figure 2.
Figure 2.. Temporal changes in body composition following refeeding after 60% caloric restriction.
Six days of 60% caloric restriction in male mice led to significant reductions in both fat mass and lean mass when quantified as either % of body weight (Day 0, panels A and B,) or absolute change in mass (Day 0, panels C and D). The effect on fat mass persisted during the first two days of the refeeding period (Day 1 and 2, panels A and C). In terms of overall body composition, the reduction in fat mass represented a 50% reduction in % fat mass relative to ad libitum fed (Ad-lib) controls (Day 0, panel A). Data are expressed as mean ± SD. Data were analyzed via two-way ANOVA. Group differences on each Day were determined via Bonferroni’s multiple comparison test with significance levels as follows: ***- p ≤ 0.001. n=52 per group baseline, Day 0 and Day 1, n=35 per group Day 2, and n=21 per group on Day 4.
Figure 3.
Figure 3.. Temporal changes in hormones and metabolites following refeeding after 60% caloric restriction in male mice.
Six days of 60% caloric restriction in mice led to significant reductions in fasting glucose, leptin, and hepatic glycogen levels (Day 0, Panels A, B, and C), while significantly increasing fasting ghrelin and β-hydroxybutyrate levels (Day 0, Panels D and E). Following a single day of refeeding, levels of hepatic glycogen, ghrelin, and β-hydroxybutyrate normalized and were not significantly different from ad libitum fed control mice for the remainder of the refeeding period, with the exception of Day 4 hepatic glycogen (Day 1, 2, and 4, Panels C, D, and E). In contrast, fasting glucose and leptin remained significantly lower during the first day of refeeding in mice exposed to 60% caloric restriction before returning to levels similar to Ad-lib mice on Days 2 and 4 of the refeeding period (Panels A and B). Fasting glucagon levels were not significantly different between the two groups on the final day of caloric restriction (Day 0, Panel E), nor were there any differences between the groups during the refeeding period (Days 1, 2, and 4, Panel E). Data are expressed as mean ± SD. Data were analyzed via two-way ANOVA. Group differences on each day were determined via Bonferroni’s multiple comparison test with significance levels as follows: *- p ≤ 0.05; **- ≤ <0.01; ***- p ≤ 0.001. n= 7–8/group (A and B); n= 5–8/group (D, E, and F); n= 4–6/group (C).
Figure 4.
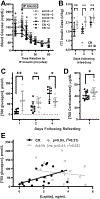
Figure 4.. Hypoglycemic counterregulation is impaired following exposure to six days of 60% caloric restriction and is associated with hypoleptinemia.
One, two, and four days following refeeding, neuroendocrine responses to insulin-induced hypoglycemia were assessed (A) in male mice previously exposed to a six-day 60% caloric restriction paradigm (CR, black) and ad libitum fed controls (Ad-lib, grey). In order to overcome differences in insulin sensitivity and fasting blood glucose levels between groups, a variable dose of insulin (IP) was used to produce equivalent exposure to hypoglycemia (A,B). Mice exposed to 60% caloric restriction displayed a significant reduction in hypoglycemia-stimulated glucagon release on Day 1 and a significant increase in glucagon release on Day 4 relative to control mice, while no between-group differences occurred on Day 2 (C). Hypoglycemia-induced corticosterone levels were also reduced one day following refeeding (D, p = 0.034). The impairment in hypoglycemia-induced glucagon release on Day 1 was significantly corredlated with the degree of hypoleptinemia experienced by CR mice, while there was no relationship between leptin levels and glucagon levels in Ad-lib mice (E). Data are expressed as mean ± SD, and were analyzed via two-way ANOVA or t-test (corticosterone data). Group differences on each day of refeeding were determined via Bonferroni’s multiple comparison test with significance levels as follows: *- p ≤ 0.05; **- p <0.01; n= 8–10/group (A and C), n= 5–7/group (B), and 14–15/group (D). P-values and r-squared values, along with curve fits (black and grey lines), were determined by simple linear regression analysis (E), and the values of these parameters for each group can be found in the figure legend.
Figure 5.
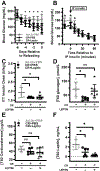
Figure 5.. Leptin treatment during caloric restriction restores normal hypoglycemia-induced glucagon release without reversing hypoleptinemia.
Two groups of male mice were exposed to a six-day 60% caloric restriction paradigm and received either twice-daily leptin treatment (CR+Leptin, black semicircles) or PBS injections (CR+PBS, black circles) during the CR paradigm. A third group consisted of ad libitum fed control animals (Ad-lib, grey squares). Non-fasted blood glucose levels during the period of caloric restriction were similar in CR+PBS and CR+Leptin mice, but reduced in both groups relative to Ad-lib mice on the last five days of restriction (A). One day following refeeding, counterregulatory hormone levels were assessed following insulin-induced hypoglycemia in all three groups (B). In order to overcome differences in insulin sensitivity and fasting blood glucose levels between the control and CR groups, a variable dose of insulin (IP) was used to produce equivalent exposure to hypoglycemia (C). Hypoglycemia-induced glucagon levels were significantly reduced in the PBS treated CR mice relative to ad-lib mice, while leptin-treated CR mice showed no deficit (D). There were no differences in corticosterone levels between the three groups 60 minutes following insulin treatment (E), but leptin levels were significantly reduced in both CR+PBS and CR+Leptin mice at this time point relative to ad-lib mice (F). Data are expressed as mean ± SD. Data were analyzed via two-way ANOVA (A and B) or one-way ANOVA (C-F) and group differences were determined via Bonferroni’s multiple comparison test relative to control mice. *- p ≤ 0.05.
Figure 6.
Figure 6.. Leptin treatment during exposure to three days of recurrent hypoglycemia restores normal hypoglycemia-induced epinephrine levels in male rats.
Counterregulatory hormone and leptin levels were assessed following insulin-induced hypoglycemia in three groups of rats. Two groups were exposed to three days of recurrent hypoglycemia (3dRH) via IP insulin and received either daily leptin (3dRH-Leptin, black semicircles) or PBS injections (3dRH-PBS, black circles) during the 3dRH paradigm. One group received neither leptin nor insulin (Control, grey squares). Glucose levels of the three groups during both the 3dRH paradigm and final bout of hypoglycemia are shown in Panel A. Following exposure to 3dRH, hypoglycemia-induced epinephrine levels were significantly reduced in the 3dRH-PBS rats relative to controls, while 3dRH-Leptin rats showed no deficit (B). There were no differences in corticosterone levels between the three groups 60 minutes following insulin treatment (C). Leptin levels at the 60-minute time point in 3dRH-PBS rats were not different from control rats, while leptin levels of 3dRH-Leptin rats were significantly increased (D). Data were analyzed via two-way ANOVA (glucose) or one-way ANOVA (hormones), and group differences were determined via Bonferroni’s multiple comparison test relative to control rats. *- p ≤ 0.05.

Similar articles

Cited by

References

    1. Adamson U, Lins PE, et al. (1989). "Fasting for 72 h decreases the responses of counterregulatory hormones to insulin-induced hypoglycaemia in normal man." Scandinavian journal of clinical and laboratory investigation 49(8): 751–756. - PubMed
    1. Ahren B (2000). "Diurnal variation in circulating leptin is dependent on gender, food intake and circulating insulin in mice." Acta physiologica Scandinavica 169(4): 325–331. - PubMed
    1. Allars J and York DA (1986). "The effects of 2-deoxy-D-glucose on brown adipose tissue of lean and obese Zucker rats." International journal of obesity 10(2): 147–158. - PubMed
    1. Bagnasco M, Kalra PS, et al. (2002). "Ghrelin and Leptin Pulse Discharge in Fed and Fasted Rats." Endocrinology 143(2): 726–729. - PubMed
    1. Beall C, Ashford ML, et al. (2012). "The physiology and pathophysiology of the neural control of the counterregulatory response." American Journal of Physiology-Regulatory Integrative and Comparative Physiology 302(2): R215–R223. - PubMed

Publication types