The effects of graded calorie restriction XVII: Multitissue metabolomics reveals synthesis of carnitine and NAD, and tRNA charging as key pathways
- PMID: 34330829
- PMCID: PMC8346868
- DOI: 10.1073/pnas.2101977118
The effects of graded calorie restriction XVII: Multitissue metabolomics reveals synthesis of carnitine and NAD, and tRNA charging as key pathways
Abstract
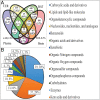
The evolutionary context of why caloric restriction (CR) activates physiological mechanisms that slow the process of aging remains unclear. The main goal of this analysis was to identify, using metabolomics, the common pathways that are modulated across multiple tissues (brown adipose tissue, liver, plasma, and brain) to evaluate two alternative evolutionary models: the "disposable soma" and "clean cupboards" ideas. Across the four tissues, we identified more than 10,000 different metabolic features. CR altered the metabolome in a graded fashion. More restriction led to more changes. Most changes, however, were tissue specific, and in some cases, metabolites changed in opposite directions in different tissues. Only 38 common metabolic features responded to restriction in the same way across all four tissues. Fifty percent of the common altered metabolites were carboxylic acids and derivatives, as well as lipids and lipid-like molecules. The top five modulated canonical pathways were l-carnitine biosynthesis, NAD (nicotinamide adenine dinucleotide) biosynthesis from 2-amino-3-carboxymuconate semialdehyde, S-methyl-5'-thioadenosine degradation II, NAD biosynthesis II (from tryptophan), and transfer RNA (tRNA) charging. Although some pathways were modulated in common across tissues, none of these reflected somatic protection, and each tissue invoked its own idiosyncratic modulation of pathways to cope with the reduction in incoming energy. Consequently, this study provides greater support for the clean cupboards hypothesis than the disposable soma interpretation.
Keywords: aging; calorie restriction; evolution; life span; metabolomics.
Conflict of interest statement
The authors declare no competing interest.
Figures
Similar articles
-
The Effects of Graded Levels of Calorie Restriction: XIX. Impact of Graded Calorie Restriction on Protein Expression in the Liver.J Gerontol A Biol Sci Med Sci. 2023 Jul 8;78(7):1125-1134. doi: 10.1093/gerona/glad017. J Gerontol A Biol Sci Med Sci. 2023. PMID: 36757838 Free PMC article.
-
The effects of graded levels of calorie restriction: IX. Global metabolomic screen reveals modulation of carnitines, sphingolipids and bile acids in the liver of C57BL/6 mice.Aging Cell. 2017 Jun;16(3):529-540. doi: 10.1111/acel.12570. Epub 2017 Jan 31. Aging Cell. 2017. PMID: 28139067 Free PMC article.
-
Depot-specific regulation of NAD+/SIRTs metabolism identified in adipose tissue of mice in response to high-fat diet feeding or calorie restriction.J Nutr Biochem. 2020 Jun;80:108377. doi: 10.1016/j.jnutbio.2020.108377. Epub 2020 Mar 19. J Nutr Biochem. 2020. PMID: 32278117
-
SIRT1 and caloric restriction: an insight into possible trade-offs between robustness and frailty.Curr Opin Clin Nutr Metab Care. 2009 Jul;12(4):350-6. doi: 10.1097/MCO.0b013e32832c932d. Curr Opin Clin Nutr Metab Care. 2009. PMID: 19474721 Free PMC article. Review.
-
Regulation of yeast sirtuins by NAD(+) metabolism and calorie restriction.Biochim Biophys Acta. 2010 Aug;1804(8):1567-75. doi: 10.1016/j.bbapap.2009.09.030. Epub 2009 Oct 8. Biochim Biophys Acta. 2010. PMID: 19818879 Free PMC article. Review.
Cited by
-
Benefits of calorie restriction in mice are mediated via energy imbalance, not absolute energy or protein intake.Geroscience. 2024 Oct;46(5):4809-4826. doi: 10.1007/s11357-024-01166-4. Epub 2024 Jun 8. Geroscience. 2024. PMID: 38850387 Free PMC article.
-
Caloric restriction, Sirtuins, and cardiovascular diseases.Chin Med J (Engl). 2024 Apr 20;137(8):921-935. doi: 10.1097/CM9.0000000000003056. Epub 2024 Mar 25. Chin Med J (Engl). 2024. PMID: 38527930 Free PMC article. Review.
-
Calorie restriction modulates the transcription of genes related to stress response and longevity in human muscle: The CALERIE study.Aging Cell. 2023 Dec;22(12):e13963. doi: 10.1111/acel.13963. Epub 2023 Oct 12. Aging Cell. 2023. PMID: 37823711 Free PMC article. Clinical Trial.
-
The Effects of Graded Levels of Calorie Restriction: XX. Impact of Long-Term Graded Calorie Restriction on Survival and Body Mass Dynamics in Male C57BL/6J Mice.J Gerontol A Biol Sci Med Sci. 2023 Oct 28;78(11):1953-1963. doi: 10.1093/gerona/glad152. J Gerontol A Biol Sci Med Sci. 2023. PMID: 37354128 Free PMC article.
-
The Effects of Graded Levels of Calorie Restriction: XIX. Impact of Graded Calorie Restriction on Protein Expression in the Liver.J Gerontol A Biol Sci Med Sci. 2023 Jul 8;78(7):1125-1134. doi: 10.1093/gerona/glad017. J Gerontol A Biol Sci Med Sci. 2023. PMID: 36757838 Free PMC article.
References
-
- Speakman J. R., Mitchell S. E., Caloric restriction. Mol. Aspects Med. 32, 159–221 (2011). - PubMed
-
- Weindruch R., Walford R. L., Retardation of Aging and Disease by Dietary Restriction (C. C. Thomas, 1988).
-
- Osborne T. B., Mendel L. B., Ferry E. L., Wakeman A. J., The resumption of growth after long continued failure to grow. J. Biol. Chem. 23, 439–454 (1915).
Publication types
MeSH terms
Substances
Grants and funding
LinkOut - more resources
Full Text Sources


