iBet uBet web content aggregator. Adding the entire web to your favor.


Link to original content: http://pubmed.ncbi.nlm.nih.gov/33620118/
Activated microglia drive demyelination via CSF1R signaling - PubMed Skip to main page content
U.S. flag

An official website of the United States government

Dot gov

The .gov means it’s official.
Federal government websites often end in .gov or .mil. Before sharing sensitive information, make sure you’re on a federal government site.

Https

The site is secure.
The https:// ensures that you are connecting to the official website and that any information you provide is encrypted and transmitted securely.

Access keys NCBI Homepage MyNCBI Homepage Main Content Main Navigation
. 2021 Jun;69(6):1583-1604.
doi: 10.1002/glia.23980. Epub 2021 Feb 23.

Activated microglia drive demyelination via CSF1R signaling

Affiliations

Activated microglia drive demyelination via CSF1R signaling

Dave E Marzan et al. Glia. 2021 Jun.

Abstract

Microgliosis is a prominent pathological feature in many neurological diseases including multiple sclerosis (MS), a progressive auto-immune demyelinating disorder. The precise role of microglia, parenchymal central nervous system (CNS) macrophages, during demyelination, and the relative contributions of peripheral macrophages are incompletely understood. Classical markers used to identify microglia do not reliably discriminate between microglia and peripheral macrophages, confounding analyses. Here, we use a genetic fate mapping strategy to identify microglia as predominant responders and key effectors of demyelination in the cuprizone (CUP) model. Colony-stimulating factor 1 (CSF1), also known as macrophage colony-stimulating factor (M-CSF) - a secreted cytokine that regulates microglia development and survival-is upregulated in demyelinated white matter lesions. Depletion of microglia with the CSF1R inhibitor PLX3397 greatly abrogates the demyelination, loss of oligodendrocytes, and reactive astrocytosis that results from CUP treatment. Electron microscopy (EM) and serial block face imaging show myelin sheaths remain intact in CUP treated mice depleted of microglia. However, these CUP-damaged myelin sheaths are lost and robustly phagocytosed upon-repopulation of microglia. Direct injection of CSF1 into CNS white matter induces focal microgliosis and demyelination indicating active CSF1 signaling can promote demyelination. Finally, mice defective in adopting a toxic astrocyte phenotype that is driven by microglia nevertheless demyelinate normally upon CUP treatment implicating microglia rather than astrocytes as the primary drivers of CUP-mediated demyelination. Together, these studies indicate activated microglia are required for and can drive demyelination directly and implicate CSF1 signaling in these events.

Keywords: astrocyte; colony-stimulating factor 1; cuprizone; demyelination; microglia; myelin; oligodendrocyte.


Conflict of interest statement

Conflict of Interest Statement: BLW is a former employee of Plexxikon, Inc. The remaining authors declare no conflict of interests.

Figures

Figure 1.
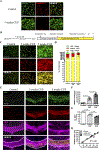
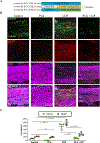
Figure 1.. Genetic labeling identifies microglia in the cuprizone model of demyelination.
A. High power micrographs of the corpus callosum of mice on control and cuprizone (5 week) diets stained for CD11b and TMEM119; the latter marker is markedly downregulated despite a striking increase in the numbers of CD11b+ cells. Scale bar, 100 µm. B. Schematic of experimental design. CX3CR1CreER-iresGFP/+;Rosa26stop-DsRed mice were treated with tamoxifen. After an additional month to ensure replacement of macrophages by DsRed-negative precursors, mice were placed on a cuprizone diet (CUP) for 3 or 5 weeks then analyzed. C. Confocal micrographs of coronal brain sections of CUP treated mice at higher magnification demonstrate virtually all cells are GFP and DsRed positive. Scale bar,100 µm. C. Quantification of fate mapped cells following cuprizone treatment. Bar graph showing the distribution of GFP+ DsRed- cells (green), GFP- DsRed+ cells (red), and GFP+ DsRed+ double positive cells (yellow) indicates that nearly all cells are microglia (i.e. DsRed+). N= 4 per group; data are mean + SEM; Student’s t-test. E. Confocal micrographs of coronal brain sections of CUP treated CX3CR1CreER-iresGFP/+;Rosa26stop-DsRed mice were stained for GFP or DsRed, and MBP (magenta). Essentially all cells are both GFP and DsRed positive and microgliosis and demyelination are tightly correlated. Scale bar, 200 μm. F. Quantification of the numbers of dsRed+ cells (i.e. microglia) in the CC of mice on control or cuprizone (3 or 5 weeks) diets. G. Quantification of the percentage of the CC positive for MBP relative to controls for mice on control and CUP (3 and 5 weeks) diets. Each symbol represents 1 animal. N=4 per group; data are mean + SEM. H. Linear regression correlating microgliosis to demyelination in the CC based on quantifications in Figs. 1F and G; R2 = 0.97.
Figure 2:
Figure 2:. CSF1 is upregulated during cuprizone-mediated demyelination
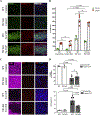
A. Micrographs of the CC from mice on a control or a CUP diet were stained for Iba1 and probed for expression of IL34 (red) and CSF1 (green) transcripts by RNAscope. Scale bar, 20 µm. Boxed regions in the merged panels are shown at higher magnification and demonstrate a significant upregulation of CSF1 but not IL34. B. Quantification of IL34 and CSF1 expression in the CC from control and cuprizone treated mice based on puncta detected by RNAscope. Each point shown in the graph represents a single mouse. C. CSF1 expression detected by RNAscope correlates with location of microglia (stained for Iba1) but not astrocytes (stained for GFAP). Scale bar, 20µm.
Figure 3.
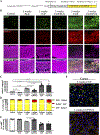
Figure 3.. Depletion of microglia via CSF1R inhibition delays demyelination.
A. Schematic of experimental design. CX3CR1CreER-iresGFP/+;Rosa26stop-DsRed mice were treated with tamoxifen and after an additional month were placed on CUP for 3 or 5 weeks, PLX for 5 weeks, or CUP/PLX for 3 or 5 weeks. B. Confocal micrographs of coronal brain sections of CUP treated mice were stained for GFP, DsRed and MBP (magenta). Microglia are nearly absent after PLX treatment. Microglia increase modestly with 3 weeks of CUP but not when CUP is combined with PLX. Microglia increased dramatically with 5 weeks of CUP and CUP/PLX. The extent of demyelination is closely correlated to the levels of microglia. Scale bar, 100 μm. C. Quantification of the total numbers of DsRed+ microglia/mm2 in different treatment groups are shown. Groups include mice on control diet (N=4), 5 weeks PLX (N=3), 3 weeks CUP (N=3), 3 weeks CUP/PLX (N=5), 5 weeks CUP (N=3) and 5 weeks of CUP/PLX (N=4). Data are mean + SEM. D. Quantification of the proportion of microglia, i.e. DsRed+ (red) and GFP+ DsRed+ double positive (yellow) cells vs. macrophages, i.e. GFP+ DsRed- (green) cells; groups are the same as those shown in panel C. E. Quantification of MBP levels in the CC, graphed relative to control diet mice; each symbol represents a single mouse. F. Representative micrographs from the cortices of mice shown in panel B on 5 weeks of CUP or 5 weeks of CUP/PLX were stained for GFP, DsRed, and Hoechst (blue). While large numbers of microglia are present in the CC of mice on CUP/PLX at 5 weeks, they are largely depleted in the cortex.
Figure 4.
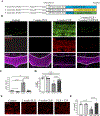
Figure 4.. Prophylactic depletion of microglia prevents CUP-mediated demyelination and oligodendrocyte loss
A. Schematic of experimental design. CX3CR1CreER-iresGFP/+;Rosa26stop-DsRed mice were treated with tamoxifen. After an additional month, one group of mice received PLX for 7 weeks, PLX for 2 weeks followed by CUP/PLX for 5 weeks, or CUP alone for 5 weeks. B. Confocal micrographs from the CC stained for GFP, DsRed, and MBP. Treatment with PLX alone ablates microglia. Similarly, pretreatment with PLX followed by ongoing CUP/PLX treatment abrogates CUP mediate microgliosis and substantially attenuates demyelination. Scale bar, 200 μm. C. Quantification of DsRed+ microglia/mm2 in the CC of mice on control diet (N = 4), 7 weeks PLX (N = 4), 5 weeks of CUP (N = 5) and 2 weeks PLX + 5 weeks CUP/PLX (PLX + C/P; N = 4). D. Quantification of MBP levels in the CC of the mouse groups shown in Fig. 4B. E. Confocal micrographs of the CC stained for the mature oligodendrocyte marker, CC1/APC. F. Quantification of the numbers of oligodendrocytes (CC1/APC+ cells) /per mm2 from the experimental groups shown in Panel E. Each symbol represents an individual mouse; data are mean + SEM.
Figure 5.
Figure 5.. Electron microscopic analysis of CUP-treated myelin in the presence or absence of microglia
A. Electron micrographs of the CC of mice fed a control diet or diets of CUP (5 weeks), CUP/PLX (5 weeks), and PLX for 2 weeks then PLX/CUP (5 weeks). There is substantial demyelination of the CC of mice on CUP and CUP/PLX vs. near complete protection of myelin in the PLX+ CUP/PLX cohort. Scale bar, 2 μm. B. Comparison of the morphology of myelin sheaths in controls vs. PLX + CUP/PLX cohort show myelin spacing is equivalent and well preserved in the latter case. C. G ratios for myelin in the CC of controls vs. those in the PLX + CUP/PLX cohort are similar. D. Quantification of the percentage of myelinated vs. unmyelinated axons in the CC of mice on control diet, or treated with cuprizone for 5 weeks or with PLX for 2 weeks then CUP/PLX for 5 weeks. E. High power electron micrograph showing pathology of myelinated axons in the CUP/PLX callosum adjacent to a microglial cell (MG) at the bottom left of the micrograph. Axons 1 and 3 demonstrate myelin sheaths that are vesiculated adjacent to the axon; axon 2 is completely demyelinated. F. High power electron micrograph showing pathology of myelinated axons in the CUP/PLX callosum that are not in evident contact with microglia in the section shown. Axons 1 and 2 show severe vesiculation and partial loss of the myelin sheaths. Axon 3 shows split myelin lamellae resulting in a double myelin profile. G. A portion of a microglial cell filled with myelin debris in the CC of mice treated with CUP/PLX for 5 weeks; the nucleus of the cell evident at the bottom right is labeled. Scale bar, 1 µm. The inset shows a higher magnification of the boxed region and demonstrates several large, irregular and partially degraded fragments of myelin, whose multilamellar organization is still partially visible.
Figure 6.
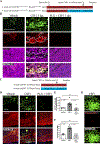
Figure 6.. Focal injection of CSF1 is sufficient to induce demyelination only in the presence of microglia.
A. Schematic of the experimental design for the stereotactic injection of vehicle or rCSF1 into the CC of CX3CR1CreER-iresGFP/+;Rosa26stop-DsRed mice on a control diet or on a PLX diet (pretreated for 2 weeks, then maintained on PLX for an additional 3 days). B. Corresponding confocal micrographs from the CC of mice injected with CSF1 on a control or PLX diet were stained for GFP, DsRed, and MBP (magenta). The area of focal demyelination associated with the microgliosis (DsRed+ cells) induced by CSF1 is outlined. Scale bar, 100 μm. C. Schematic of the experimental design for the stereotactic injection of CSF1 into the CC of WT mice on control (CSF1) or PLX (PLX + CSF1) diets. D. Confocal micrographs of the CC stained for CD11b (green), MBP (Red) and cell nuclei (DAP, blue) following injection of rCSF1 into WT mice on a control (CSF1) or a PLX (PLX+CSF1) diet. Scale bar, 100 μm. E. Quantification of the percentage of CD11b+ cells in focal sites of injection resulting from vehicle injection (taken as 100%; N=4) and of rCSF1 injection into the CC of mice on a control diet (CSF1; N=6) or a PLX diet (N=5; PLX + CSF1) compared to vehicle controls. Each symbol represents 1 animal; data are mean + SEM. F. Quantification of demyelination, based on MBP levels, at sites of rCSF1 injection for WT mice or PLX treated mice. G. Microglia (CD11b, green) induced by CSF1 injection into the CC do not express Tmem119. Scale bar, 72 μm.
Figure 7:
Figure 7:. Demyelination is accompanied by astrogliosis
A. Schematic of experimental design to assess the impact of ablating microglia on astrogliosis. B. Representative coronal sections from mice on control, PLX, cuprizone or PLX + CUP/PLX diets were stained for microglia (CD11b; green), reactive astrocytes (GFAP; red) and MBP (magenta). C. Quantification of the numbers of microglia and astrocytes in the CC of mice on control, PLX, cuprizone, or PLX + CUP/PLX diets. Each point shown is the quantification of microglial and astrocytic numbers in the corpus callosum from an individual mouse.
Figure 8.
Figure 8.. Demyelination remains robust in a mouse model of defective astrocyte activation
A. Micrographs of coronal sections of the CC of WT and TNFα/IL1/C1q (TIC) triple knockout mice on control or cuprizone diets were stained for microglia (CD11b; green), reactive astrocytes (GFAP; red) and cell nuclei (DAPI; blue). B. Quantification of the numbers of CD11b+ (green) and GFAP+ (red) cells/mm2 in the CC of control and TIC KO mice; each point shown in the graph is from the analysis of an individual mouse. There are no significant differences between WT and TIC knockouts in the numbers of microglia or astrocytes when mice are on CUP. C. Micrographs of coronal sections of the corpus callosum of WT and TNFα/IL1/C1q (TIC) triple knockout mice maintained on control or cuprizone diets were stained for MBP (magenta) and cell nuclei (DAPI) and monitored for expression of C3 by RNA scope (red). D. Top: quantification of MBP staining of the corpus callosum of WT and TNFα/IL1/C1q (TIC) triple knockout mice maintained on control or cuprizone diets; results show loss of MBP staining in the TIC knockouts was similar to that in WT mice. Bottom: quantification of C3 expression in the corpus callosum of WT and TNFα/IL1/C1q (TIC) triple knockout mice on control or cuprizone diets; the increase in C3 expression resulting from cuprizone treatment was significantly reduced in the TIC KOs compared to WT mice.

Similar articles

Cited by

  • The Hidden Hand in White Matter: Pericytes and the Puzzle of Demyelination.
    Raj S, Sarangi P, Goyal D, Kumar H. Raj S, et al. ACS Pharmacol Transl Sci. 2024 Sep 19;7(10):2912-2923. doi: 10.1021/acsptsci.4c00192. eCollection 2024 Oct 11. ACS Pharmacol Transl Sci. 2024. PMID: 39421660 Review.
  • Integrated multimodal cell atlas of Alzheimer's disease.
    Gabitto MI, Travaglini KJ, Rachleff VM, Kaplan ES, Long B, Ariza J, Ding Y, Mahoney JT, Dee N, Goldy J, Melief EJ, Agrawal A, Kana O, Zhen X, Barlow ST, Brouner K, Campos J, Campos J, Carr AJ, Casper T, Chakrabarty R, Clark M, Cool J, Dalley R, Darvas M, Ding SL, Dolbeare T, Egdorf T, Esposito L, Ferrer R, Fleckenstein LE, Gala R, Gary A, Gelfand E, Gloe J, Guilford N, Guzman J, Hirschstein D, Ho W, Hupp M, Jarsky T, Johansen N, Kalmbach BE, Keene LM, Khawand S, Kilgore MD, Kirkland A, Kunst M, Lee BR, Leytze M, Mac Donald CL, Malone J, Maltzer Z, Martin N, McCue R, McMillen D, Mena G, Meyerdierks E, Meyers KP, Mollenkopf T, Montine M, Nolan AL, Nyhus JK, Olsen PA, Pacleb M, Pagan CM, Peña N, Pham T, Pom CA, Postupna N, Rimorin C, Ruiz A, Saldi GA, Schantz AM, Shapovalova NV, Sorensen SA, Staats B, Sullivan M, Sunkin SM, Thompson C, Tieu M, Ting JT, Torkelson A, Tran T, Valera Cuevas NJ, Walling-Bell S, Wang MQ, Waters J, Wilson AM, Xiao M, Haynor D, Gatto NM, Jayadev S, Mufti S, Ng L, Mukherjee S, Crane PK, Latimer CS, Levi BP, Smith KA, Close JL, Miller JA, Hodge RD, Larson EB, Grabowski TJ, Hawrylycz M, Keene CD, Lein ES. Gabitto MI, et al. Nat Neurosci. 2024 Dec;27(12):2366-2383. doi: 10.1038/s41593-024-01774-5. Epub 2024 Oct 14. Nat Neurosci. 2024. PMID: 39402379 Free PMC article.
  • Glial Cells as Key Regulators in Neuroinflammatory Mechanisms Associated with Multiple Sclerosis.
    Theophanous S, Sargiannidou I, Kleopa KA. Theophanous S, et al. Int J Mol Sci. 2024 Sep 4;25(17):9588. doi: 10.3390/ijms25179588. Int J Mol Sci. 2024. PMID: 39273535 Free PMC article. Review.
  • Deciphering glial contributions to CSF1R-related disorder via single-nuclear transcriptomic profiling: a case study.
    Pan J, Fores-Martos J, Delpirou Nouh C, Jensen TD, Vallejo K, Cayrol R, Ahmadian S, Ashley EA, Greicius MD, Cobos I. Pan J, et al. Acta Neuropathol Commun. 2024 Aug 28;12(1):139. doi: 10.1186/s40478-024-01853-5. Acta Neuropathol Commun. 2024. PMID: 39217398 Free PMC article.
  • Microglia specific alternative splicing alterations in multiple sclerosis.
    Qi C, Ren H, Fan Y. Qi C, et al. Aging (Albany NY). 2024 Aug 7;16(15):11656-11667. doi: 10.18632/aging.206045. Epub 2024 Aug 7. Aging (Albany NY). 2024. PMID: 39115871 Free PMC article.

References

    1. Abdollahzadeh A, Belevich I, Jokitalo E, Tohka J, & Sierra A (2019). Automated 3D Axonal Morphometry of White Matter. Sci Rep, 9(1), 6084. doi:10.1038/s41598-019-42648-2 - DOI - PMC - PubMed
    1. Ács P, & Komoly S (2012). Selective ultrastructural vulnerability in the cuprizone-induced experimental demyelination. Ideggyogyaszati Szemle, 65(7–8), 266–270. - PubMed
    1. Adams SJ, Kirk A, & Auer RN (2018). Adult-onset leukoencephalopathy with axonal spheroids and pigmented glia (ALSP): Integrating the literature on hereditary diffuse leukoencephalopathy with spheroids (HDLS) and pigmentary orthochromatic leukodystrophy (POLD). J Clin Neurosci, 48, 42–49. doi:10.1016/j.jocn.2017.10.060 - DOI - PubMed
    1. Ajami B, Bennett JL, Krieger C, McNagny KM, & Rossi FMV (2011). Infiltrating monocytes trigger EAE progression, but do not contribute to the resident microglia pool. Nature Neuroscience, 14(9), 1142–1149. doi:10.1038/nn.2887 - DOI - PubMed
    1. Ajami B, Bennett JL, Krieger C, Tetzlaff W, & Rossi FMV (2007). Local self-renewal can sustain CNS microglia maintenance and function throughout adult life. Nature Neuroscience, 10(12), 1538–1543. doi:10.1038/nn2014 - DOI - PubMed

Publication types

Substances