iBet uBet web content aggregator. Adding the entire web to your favor.


Link to original content: http://pubmed.ncbi.nlm.nih.gov/33370241/
International Union of Basic and Clinical Pharmacology. CX. Classification of Receptors for 5-hydroxytryptamine; Pharmacology and Function - PubMed Skip to main page content
U.S. flag

An official website of the United States government

Dot gov

The .gov means it’s official.
Federal government websites often end in .gov or .mil. Before sharing sensitive information, make sure you’re on a federal government site.

Https

The site is secure.
The https:// ensures that you are connecting to the official website and that any information you provide is encrypted and transmitted securely.

Access keys NCBI Homepage MyNCBI Homepage Main Content Main Navigation
Review
. 2021 Jan;73(1):310-520.
doi: 10.1124/pr.118.015552.

International Union of Basic and Clinical Pharmacology. CX. Classification of Receptors for 5-hydroxytryptamine; Pharmacology and Function

Affiliations
Review

International Union of Basic and Clinical Pharmacology. CX. Classification of Receptors for 5-hydroxytryptamine; Pharmacology and Function

Nicholas M Barnes et al. Pharmacol Rev. 2021 Jan.

Abstract

5-HT receptors expressed throughout the human body are targets for established therapeutics and various drugs in development. Their diversity of structure and function reflects the important role 5-HT receptors play in physiologic and pathophysiological processes. The present review offers a framework for the official receptor nomenclature and a detailed understanding of each of the 14 5-HT receptor subtypes, their roles in the systems of the body, and, where appropriate, the (potential) utility of therapeutics targeting these receptors. SIGNIFICANCE STATEMENT: This review provides a comprehensive account of the classification and function of 5-hydroxytryptamine receptors, including how they are targeted for therapeutic benefit.


Figures

Fig. 1.
Fig. 1.
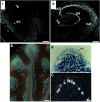
In situ hybridization detection of 5-HT1A receptor mRNA expression in rat (A) and human brain (B) at the level of the hippocampus. CA1, dentate gyrus (DG) of the hippocampus, and parahippocampal gyrus (PHG) are shown. Adapted from Burnet et al. (1995) (with permission).
Fig. 2.
Fig. 2.
Biased agonism at the 5-HT1A receptor offers the potential to target subpopulations of 5-HT1A receptors.
Fig. 3.
Fig. 3.
The evolution of “5-HT1–like” receptors into the different sumatriptan-sensitive 5-HT1 receptor subtypes and the sumatriptan-insensitive 5-HT7 receptor. Modified from Saxena et al. (1998). For references, see Hartig et al. (1996), Hoyer and Martin (1997), Villalón et al. (1997a), and Villalón and Centurión (2007).
Fig. 4.
Fig. 4.
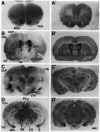
In situ hybridization detection of 5-HT1B and 5-HT1D receptor mRNA in rat brain (and 5-HT1B receptor mRNA in the posterior communicating artery [reverse autoradiogram; K]). 5-HT1B (B–K) and 5-HT1D (B’–J’) receptor mRNA. Ace, nucleus accumbens; AON, anterior olfactory nucleus; Arc, arcuate hypothalamic nucleus; AV, anteroventral thalamic nucleus; BL, basolateral amygdaloid nucleus; CA1, CA1 region of the hippocampus; CgCx, cingulate cortex; CPu, caudate putamen; DK, nucleus of Darkschewitsch; FrCx [layer VI], frontal cortex; IP, interpeduncular nucleus; IPIP, inner posterior subnucleus of the interpeduncular nucleus; layers III and V, parietal motor cortex; MVe, medial vestibular nucleus; PCA, posterior communicating artery; PO, primary olfactory cortex; Pur, Purkinje cells of the cerebellum; R, red nucleus; Re, reuniens nucleus; STh, subthalamic nucleus; SuG, superficial gray layer of the superior colliculus; Tu, olfactory tubercle. Scale bar, 5 mm (except K, where it is 0.5 mm). Adapted from Bruinvels et al. (1994a) (with permission).
Fig. 5.
Fig. 5.
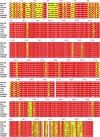
Alignment of human 5-ht1e and 5-HT1F receptor amino acid sequences. Sequence homology is assessed by Basic Local Alignment Search Tool (BLAST, copyright National Library of Medicine) for protein sequences. Transmembrane domains (TMD 1–7) were determined previously (Bai et al., 2004) and highlighted by yellow rectangles. Nonpolar, uncharged polar, acidic polar, and basic polar amino acids are labeled by corresponding color.
Fig. 6.
Fig. 6.
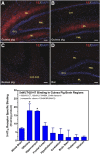
5-ht1e receptor expression in guinea pig and rat brain. The top image shows immunohistochemical staining of the 5-ht1e receptor in the hippocampus. (A) Coronal section of guinea pig hippocampus at the septal pole of the DG. (B) Coronal section of guinea pig hippocampus near the temporal pole of the DG. (C) Coronal section of rostral guinea pig hippocampus shows a lack of 5-ht1e receptor staining in the CA3-CA2 region. (D) Rat hippocampus (coronal section of DG septal pole) does not stain for 5-ht1e receptors. GCL, granular cell layer; ML, molecular layer; PML, polymorphic layer. Scale bars, 100 µm. The bottom image shows histogram of radioligand 5-ht1e receptor binding sites in homogenates of guinea pig brain. High levels of 5-ht1e receptor binding sites are detected in the hippocampus and olfactory bulb. *P < 0.05 compared with “whole-brain,” one-way ANOVA with Dunnett’s post-test. Data are the means ± S.E.M. of three independent experiments performed in triplicate. Adapted from Klein and Teitler (2012) (with permission).
Fig. 7.
Fig. 7.
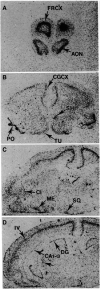
In situ hybridization detection of 5-HT1F receptor mRNA expression in guinea pig brain. (A) Frontal cortex (FRCX), anterior olfactory nucleus (AON). (B) Cingulate cortex (CGCX), septo-hippocampal nucleus (SHI), olfactory tubercle (TU), primary olfactory cortex (PO). (C) Claustrum (CL), medial amygdaloid nucleus (ME), supraoptic hypothalamic nucleus (SO). (D) Layer IV of the parietal motor cortex (IV), dentate gyrus (DG), and CA1-3 field (CA1-3) of the hippocampus are shown. Adapted from Bruinvels et al. (1994) (with permission).
Fig. 8.
Fig. 8.
Primary structure of 5-HT2A receptors from various species.
Fig. 9.
Fig. 9.
In situ hybridization detection of 5-HT2A receptor mRNA expression in rat and human brain. Reverse autoradiograms of the rat (A) and human brain (B–F). Human section: hippocampus and surrounding cortex (B), orbitofrontal cortex (Brodmann area 11) (C), striate cortex (Brodmann area 17) (D), superior temporal gyrus (Brodmann area 22) (E), and brainstem at the level of the raphe nucleus (F); no lack of 5-HT2A receptor mRNA was evident. Adapted from Burnet et al. (1995) (with permission).
Fig. 10.
Fig. 10.
Primary structure of human 5-HT2A, 5-HT2B, and 5-HT2C receptors.
Fig. 11.
Fig. 11.
5-HT2B receptor immunoreactivity in rat brain. Immunohistochemical detection of 5-HT2B receptor immunoreactivity within Purkinje cells in the cerebellum (A), multipolar neurons in the lateral septum (B), multipolar and bipolar neurons in the medial amygdala (C), and cells in the dorsal hypothalamic nucleus (D). In each case, the staining was abolished in adjacent sections by coincubation with synthetic 5-HT2B receptor peptide (data not shown). Adapted from Duxon et al. (1997) (with permission).
Fig. 12.
Fig. 12.
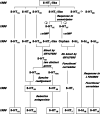
Landmarks in 5-HT2C receptor research and development. Identification and characterization of the 5-HT2C receptor and the development of 5-HT2C receptor–directed ligands has evolved over the last 40 years (black text). The 5-HT1C receptor was reclassified as the 5-HT2C receptor in the mid-1990s (purple text). Examples of novel pharmacological tools (blue text) as well as the first-in-class selective 5-HT2C receptor agonist approved for obesity (red text) are illustrated in the timeline. Refer to the text for details; superscripted numbers indicate literature citations: 1) Peroutka and Snyder, 1979; 2) Pazos et al., 1984b; Yagaloff and Hartig, 1985; 3) Closse, 1983; 4) Pazos et al., 1984a; Pazos and Palacios, 1985; Pazos et al., 1985; Hoyer et al., 1986; 5) Conn et al., 1986; Conn and Sanders-Bush, 1986a; Hoyer et al., 1989; Chang et al., 2000; 6) (rat) Lübbert et al., 1987; Julius et al., 1988; (human) Saltzman et al., 1991; Milatovich et al., 1992; Stam et al., 1994; Xie et al., 1996; (mouse) Yu et al., 1991; Foguet et al., 1992a,; 7) Hoffman and Mezey, 1989; Molineaux et al., 1989; Mengod et al., 1990; 8) Millar et al., 2007; 9) Hoyer, 1988a,b; Humphrey et al., 1993; Hoyer et al., 1994; 10) Tecott et al., 1995; 11) Berg et al., 1994, ; 12) Burns et al., 1997; 13) http://www.fda.gov/Drugs/DrugSafety/PostmarketDrugSafetyInformationforPatientsandProviders/ucm180078.htm; 14) Bromidge et al., 1997; Kennett et al., 1997; 15) Herrick-Davis et al., 1999; 16) Di Giovanni et al., 1999; Di Matteo et al., 1999; Gobert et al., 2000; 17) Bécamel et al., 2002, ; 18) Basile et al., 2002; Tsai et al., 2002; Theisen et al., 2004; Templeman et al., 2005; 19) Herrick-Davis et al., 2006; Herrick-Davis et al., 2007; 20) Rosenzweig-Lipson et al., 2007a; Tong et al., 2010; Dunlop et al., 2011; Dunlop et al., 2005; 21) Xu et al., 2008 22) Leggio et al., 2009b; 23) Kawahara et al., 2008; Morabito et al., 2010a; 24) Kishore and Stamm, 2006; Doe et al., 2009; Kishore et al., 2010; 25) Ji et al., 2006; Anastasio et al., 2013; 26) Im et al., 2003; Ding et al., 2012; Wild et al., 2019; 27) http://www.fda.gov/NewsEvents/Newsroom/PressAnnouncements/ucm309993.htm; Thomsen et al., 2008; Smith et al., 2009; Smith et al., 2010; 28) http://www.eisai.com/news/news201465.html; Cunningham and Anastasio, 2014; Rezvani et al., 2014; Higgs et al., 2015; Howell and Cunningham, 2015; Harvey-Lewis et al., 2016; 29) Nocjar et al., 2015; Anastasio et al., 2015; 30) Herrick-Davis et al., 2015; 31) Schellekens et al., 2015; Kamal et al., 2015; 32) Di Giovanni and De Deurwaerdere, 2016; Venzi et al., 2016; 33) Xu et al., 2017.
Fig. 13.
Fig. 13.
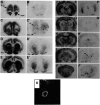
5-HT2C receptor expression in rat brain. In situ hybridization detection of 5-HT2C receptor mRNA (A–D) and 5-HT2C receptor autoradiography (A’–D’) from adjacent sections. Acb, nucleus accumbens; AON, anterior olfactory nucleus; BST, bed nucleus stria terminalis; CA1, hippocampus CA1 field; CG, central gray; ChP, choroid plexus; CPu, caudate-putamen; DG, dentate gyrus; GP, globus pallidus; Lhb, lateral habenular nucleus; MG, medial geniculate nucleus; PCg, posterior cingulate cortex; PO, primary olfactory cortex; S, subiculum; SN, substantia nigra; STh, subthalamic nucleus. Scale bar, 1 mm. Adapted from Mengod et al. (1990) (with permission).
Fig. 14.
Fig. 14.
Regional CNS localization 5-HT2C receptors and functional correlates. The full-length 5-HT2C receptor is localized exclusively in the central nervous system with good agreement between mRNA and protein distribution in the majority of brain regions. The postulated signaling components (shown in normal text), neurochemical and/or neurophysiological correlates (shown in italic text), and in vivo effects (shown in capital text) are illustrated.
Fig. 15.
Fig. 15.
Immunohistochemical detection of 5-HT3A and 5-HT3B receptor subunit expression in human hippocampus. 5-HT3A and 5-HT3B subunit immunoreactivity brown immunoreaction product in whole hippocampal section (large plates) is shown with fields of the hippocampus CA1-CA3, hilus (CA4), and dentate gyrus (DG), which are also shown at higher magnification (small plates; Scale bar, 50 µm). Immunoreactivity was not detected when either primary antibody was replaced by preimmune serum (No 1°) or following preabsorption with the immunizing peptide (peptide block). Subsequent to the detection of immunoreactivity, sections were histologically stained with hematoxylin to aid identification of hippocampal fields. Adapted from Brady et al. (2007) (with permission).
Fig. 16.
Fig. 16.
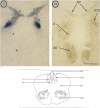
5-HT3 receptor autoradiography in the human brainstem. Left: [3H]-(S)-zacopride binding to the 5-HT3 receptor in coronal section of human brainstem at the level of the chemoreceptor trigger zone (AP, area postrema; NTS, nucleus tractus solitarius; X, dorsal motor nucleus of the vagus nerve). Right: Adjacent section stained for acetylcholinesterase (hypoglossal nerve nucleus). [3H]-(S)-zacopride binding in the presence of ondansetron (1.0 µM) was absent (data not shown).
Fig. 17.
Fig. 17.
5-HT3 receptor protein expression (5-HT3A and 5-HT3B subunits) in human gut. (A) Immunolabeling of a ganglion in the human submucous plexus with an antibody against the 5-HT3A subunit. (B) The same ganglion as in (A) stained with an antibody against the human neuronal protein HuC/HuD, which labels all neurons. All anti-HuC/HuD–positive neurons are immunoreactive for the 5-HT3A antibody. (C) Immunolabeling of another human submucous ganglion with an antibody against the 5-HT3B subunit. (D) The same ganglion as in (C) stained with anti-HuC/HuD. All anti-HuC/HuD–positive neurons were immunoreactive for the 5-HT3B antibody. Scale bar, 25 μm (A–D). (F) Detection of h5-HT3B immunoreactivity by SDS polyacrylamide gel electrophoresis/Western blot. Lane 1, HEK293 cells stably expressing with h5-HT3A subunit; lane 2, HEK293 cells stably expressing both the h5-HT3A and h5-HT3B subunits; lane 3, human large intestine; lane 4, human small intestine. Numbers are the positions of the molecular weight markers (kilodalton). Adapted from Michel et al. (2005) (with permission).
Fig. 18.
Fig. 18.
Primary structure of human 5-HT4 receptors. The amino acid sequences of the identified splice variants are depicted. 5-HT4 receptors have identical sequences up to L358 and differ by the length and composition of their C-terminal domain. The 5-HT4(h) variant, which presents an insertion of 14 residues in the second extracellular loop, has been isolated in combination with the b isoform, and it is called 5-HT4(hb). N-glycosylation sites on N7 and N180 are indicated. Palmytoylation sites on C328, C329 (common to all splice variants), and C386 (in the a isoform) are schematized. This figure has been established in accordance with the last human genome assembly (Genes, Ensembl release 82) and modified from Padayatti et al. (2013).
Fig. 19.
Fig. 19.
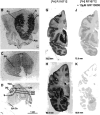
5-HT4 receptor expression in the human brain. In situ hybridization detection of 5-HT4 receptor mRNA (B–D) and 5-HT4 receptor autoradiography of radioligand binding sites [[3H]R116712 total binding (G and H) and nonspecific binding (J and K)]. Acc, nucleus accumbens; CA1-3, hippocampal fields; Cd, caudate nucleus; DG, dentate gyrus; Ent, Cx entorhinal cortex; Ic, internal capsule; Pu, putamen; S, subiculum; SN; no mRNA evident, substantia nigra; TCd, tail of caudate nucleus. Adapted from Bonaventure et al. (2000) (with permission).
Fig. 20.
Fig. 20.
Structure and activities of 5-HT4 receptor inverse agonists. The inverse agonist activity was studied according to the ability of the compounds to inhibit the constitutive activity (activity in the absence of agonists). 5-HT4(a) receptors were expressed in COS-7 cells (1500 ± 130 fmol/mg). The constitutive cAMP production in presence of the receptor is equal to 720% ± 50% of the activity obtained in the absence of receptor. From Joubert et al. (2002).
Fig. 21.
Fig. 21.
In situ hybridization detection of 5-HT5A receptor mRNA expression in mouse brain. (A) Dark field of the emulsion autoradiograph of a horizontal section through an adult mouse brain, with images at higher magnification showing (B) hippocampus and (C) cerebellum. CA1-3, CA fields of the hippocampus CA; Cb, cerebellum; Cx, cerebral cortex; DG, dentate gyrus; G, granule cell layer of the cerebellum; H, hippocampus; OB, olfactory bulb. Adapted from Plassat et al. (1992) (with permission).
Fig. 22.
Fig. 22.
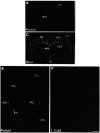
In situ hybridization detection of 5-HT5A receptor mRNA expression in human brain. (i and ii) Dark-field autoradiographs of coronal sections of human hippocampus and surrounding regions. CA1, CA3 fields and the dentate gyrus (DG) of hippocampus, entorhinal cortex (EC), and subiculum (S). Scale bars, 0.2 cm. (A) Dark-field autoradiograph of a coronal section of the cerebellar cortex: the Purkinje cells are heavily labeled [high magnification of Purkinje cells in bright-field (B) and dark-field (C)]. Scale bars, 600 µm (A), 500 µm (B), and 900 µm (C). Adapted from Pasqualetti et al. (1998b) (with permission).
Fig. 23.
Fig. 23.
In situ hybridization detection of 5-ht5b receptor mRNA expression in rat brain. Coronal (A) and horizontal (E) rat brain sections. (C) Nissl stain of the section used to generate the autoradiogram in (A). (F) Radioactive oligonucleotide probe in the presence of excess unlabeled probe. CA1 and CA3, CA fields of the hippocampus; Cb, cerebellum; CPu, caudate-putamen; Ctx, cortex; DG, dentate granule cells; Ent, entorhinal cortex; Hy, hypothalamus; MHb, medial habenula. Adapted from Wisden et al. (1993) (with permission).
Fig. 24.
Fig. 24.
Evidence for 5-HT raphe neurons expressing the 5-ht5b receptor. Top row: Visualization of 5-HTT and 5-ht5b receptor mRNAs in the dorsal raphe. (A) A consecutive section to (B and C), stained with cresyl violet for anatomic reference. The approximate limits of the dorsal raphe (DR) and its subdivisions—lateral wings and medial portion—are depicted. (B) a bright-field photomicrograph where numerous cell profiles express 5-HTT mRNA are visualized using digoxigenin-labeled oligonucleotide probes. (C) A dark-field photomicrograph from an emulsion-dipped tissue section displaying 5-ht5b receptor mRNA signal in the DR. mlf, medial longitudinal fasciculus; PAG, periaqueductal gray. Scale bar, 0.5 mm. Bottom row: Schematic representations of the rat lower midbrain and upper pons showing the subregional location of cells coexpressing 5-ht5b receptor mRNA and 5-HTT mRNA (filled circles) and cells expressing only 5-HTT mRNA (empty circles) in the DR and central superior nucleus (CS or median raphe). AQ, cerebral aqueduct; AT, anterior tegmental nucleus; dscp, decussation of the superior cerebellar peduncle; IPN, interpeduncular nucleus; tsp, tectospinal pathway; VTA, ventral tegmental area; VTN, ventral tegmental nucleus. Adapted from Serrats et al. (2004) (with permission).
Fig. 25.
Fig. 25.
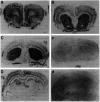
In situ hybridization detection of 5-HT6 receptor mRNA expression in rat brain. Autoradiographic visualization of 5-HT6 receptor mRNA in rat brain (A–D) and relative absence of signal when adjacent sections probed with the sense control (c and d). ANA, anterior nucleus accumbens; CgCx, cingulate cortex; Cx, cortex; DG, dentate gyrus; Hb, habenula; Hp, hippocampus; OT, olfactory tubercle; PfCx, prefrontal cortex; PyCx, pyriform cortex. Adapted from Ward et al. (1995) (with permission).
Fig. 26.
Fig. 26.
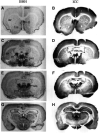
5-HT7 receptor mRNA and protein expression in rat brain. Comparative in situ hybridization localization of 5-HT7 receptor mRNA (ISHH) (A, C, E, and G) and immunocytochemical location of 5-HT7 receptor protein (ICC) (B, D, F, and H), respectively. amyg, amygdala; atn, anterior thalamic nuclei; av, anteroventral thalamic nucleus; hip, hippocampus; lsn, lateral septal nuclei; mpa, medial preoptic area; neo, neocortex; pir, piriform cortex; pvp, posterior paraventricular nucleus; pvn, paraventricular thalamic nuclei; rc, retrosplenial cortex; scn, suprachiasmatic nuclei, str, striatum; tt, tenia tecta. Adapted from Neumaier et al. (2001) (with permission).
Fig. 27.
Fig. 27.
5-HT7 receptor binding sites in human brain. Autoradiographic detection of [3H]SB-269970 binding to 5-HT7 receptors in the human brain. Autoradiograms showing the distribution of 5-HT7 receptors at the level of the thalamus (left column) and dorsal striatum (right column). (A) Plates; line drawings of brain hemisphere contours with square showing location of sections for the autoradiograms below. (B) Plates; total binding. (C) Plates; nonspecific binding (inclusion of 5-HT, 10 µM). ACG, anterior cingulate gyrus; Amg, amygdala; Ath, anterior thalamus; Ca, caudate nucleus; DG, dentate gyrus; DR, dorsal raphe; Hi, hippocampus; PCG, posterior cingulate gyrus; Pu, putamen; SN, substantia nigra; Th, thalamus. Adapted from Varnäs et al. (2004) (with permission).
Fig. 28.
Fig. 28.
Structures of 5-HT1B, 5-HT2B, and 5-HT2C receptors. PyMol renderings of the 5-HT1B receptor in complex with ergotamine (Left: Wang et al., 2013; Wacker et al., 2013) and the 5-HT2B receptor in complex with LSD (Wacker et al., 2017) demonstrating different binding pockets for ergotamine and LSD [see Wacker et al. (2017) for details]. The figure also shows inactive-state structure of the 5-HT2C receptor (Peng et al., 2018) and the G protein–coupled state of the 5-HT1B receptor (Garcia-Nafria et al., 2018)
Fig. 29.
Fig. 29.
Architecture and ligand binding sites of 5-HT3 receptors. (A) Cartoon representation of a single subunit viewed parallel to the plane of the membrane. (B) Cartoon representation of the entire pentameric receptor, in the same orientation [the subunit of (A) is equivalent to the yellow subunit]. One out of the five stabilizing VHH15 single-chain llama antibodies is shown in pale green and labeled VHH15. (C) Surface representation of the receptor highlighting binding clefts in blue (neurotransmitter site), yellow (anesthetics intrasubunit site), orange (PU-02 and anesthetics intersubunit site), purple (extracellular allosteric pocket), and olive (pore blockers site). The subunit equivalent to the one of (A) appears in darker gray.
Fig. 30.
Fig. 30.
The neurotransmitter binding site of the 5-HT3 receptor. (A) Global view of the site, at the interface between two subunits represented as cartoons, viewed from parallel to the place of the membrane. Binding elements of the principal subunit (A–C) and of the complementary subunit (D–G) are color-coded. (B) Surface view representing the electrostatic potential in the same orientation. The surface has been removed around to yellow loop (C) that would cover it, for clarity. The inset illustrates motions of loop (C) associated with binding of an agonist (blue, contracted conformation, PDB 2BYQ), an antagonist (gray, extended conformation, PDB 2C9T), or the stabilizing llama antibody VHH15 (salmon). (C) Close-up views of the binding site with essential residues, including those of the aromatic box. On the right panel, the 5-HT3A receptor structure is superimposed with the 5-HTBP structure cocrystallized with granisetron (in yellow). The principal subunits are superimposed, and, as a consequence of different subunit/subunit orientation, the strands of the complementary subunit are shifted. This superimposition illustrates the diversity and complementarity of structural templates.
Fig. 31.
Fig. 31.
The intracellular domain of the 5-HT3 receptor. (A) Surface representation of the intracellular domain viewed parallel to the membrane plane. The left part shows the external surface, whereas the right part shows a cut-through and thus depicts the intracellular vestibule, the lateral obstructed portal, and the constriction along the pore axis. The arrow indicates the plausible exit for ions. (B) Backbone representation of MA-M4 helices (gray, two subunits shown) with the numerous charged residues (blue and red for positively and negatively charged residues) depicted as sticks. The green cartoon shows for one subunit the M3 and MX helices and their connecting loop that plug the portal (yellow oval). The hydrophobic residues that create the tight bundle of MA helices are in yellow, and the triplet of arginine determinant for channel conductance are labeled in bold font.
Fig. 32.
Fig. 32.
Role of Fyn, Jab1, and SNX 1 recruitment by 5-HT6 receptor in receptor-operated signaling and functions. Association of Fyn with 5-HT6 receptor Ct increases receptor cell surface localization and, consequently, receptor-operated G protein signaling. Fyn is also involved in Erk1/2 activation by 5-HT6 receptors. Fyn phosphorylates Tau to control its association with microtubules and is involved in neuronal migration and Aβ-induced synaptic deficits and neurotoxicity. Association of 5-HT6 receptor with Jab1 stabilizes surface expression of the receptor and is essential for its activity. 5-HT6 receptor stimulation increases nuclear translocation of Jab1, a process that might reduce cell death induced by hypoxia. The 5-HT6 receptor also interacts with SNX14, which inhibits receptor functions by sequestering Gαs and promoting receptor endocytosis and degradation.
Fig. 33.
Fig. 33.
Engagement of Cdk5 and mTOR signaling pathways by 5-HT6 receptor and their role in neurodevelopmental processes and cognition. Left panel: The 5-HT6 receptor constitutively interacts with Cdk5 (and its activator p35), which phosphorylates the receptor at Ser350. This enables 5-HT6 receptor to promote neurite growth via the activation of the Rho GTPase Cdc42. Cdk5 activity, under the control of 5-HT6 receptor, also enables migration of pyramidal cortical neurons, likely via the phosphorylation of doublecortin (DCX) and focal adhesion kinase (FAK). These effects are agonist-independent and prevented by inverse agonists. Right panel: The 5-HT6 receptor recruits several proteins of the mTOR pathway, including mTOR itself and Raptor, two protein components of the mTORC1 complex, neurofibromin (NF1), Vps34, and Rheb. Prefrontal 5-HT6 receptors engage mTOR signaling upon agonist stimulation and in rat neurodevelopmental models of schizophrenia to compromise social cognition and episodic memory, whereas 5-HT6 receptor blockade by antagonists or direct mTOR inhibition by rapamycin rescue cognitive deficits in these models.

Similar articles

Cited by

References

    1. Abbas AI, Hedlund PB, Huang XP, Tran TB, Meltzer HY, Roth BL. (2009a) Amisulpride is a potent 5-HT7 antagonist: relevance for antidepressant actions in vivo. Psychopharmacology (Berl) 205:119–128. - PMC - PubMed
    1. Abbas AI, Urban DJ, Jensen NH, Farrell MS, Kroeze WK, Mieczkowski P, Wang Z, Roth BL. (2010) Assessing serotonin receptor mRNA editing frequency by a novel ultra high-throughput sequencing method. Nucleic Acids Res 38:e118. - PMC - PubMed
    1. Abbas AI, Yadav PN, Yao WD, Arbuckle MI, Grant SG, Caron MG, Roth BL. (2009b) PSD-95 is essential for hallucinogen and atypical antipsychotic drug actions at serotonin receptors. J Neurosci 29:7124–7136. - PMC - PubMed
    1. Abdala AP, Bissonnette JM, Newman-Tancredi A. (2014a) Pinpointing brainstem mechanisms responsible for autonomic dysfunction in Rett syndrome: therapeutic perspectives for 5-HT1A agonists. Front Physiol 5:205. - PMC - PubMed
    1. Abdala AP, Dutschmann M, Bissonnette JM, Paton JF. (2010) Correction of respiratory disorders in a mouse model of Rett syndrome. Proc Natl Acad Sci USA 107:18208–18213. - PMC - PubMed

Publication types

LinkOut - more resources