MicroRNA-574 regulates FAM210A expression and influences pathological cardiac remodeling
- PMID: 33369227
- PMCID: PMC7863409
- DOI: 10.15252/emmm.202012710
MicroRNA-574 regulates FAM210A expression and influences pathological cardiac remodeling
Abstract
Aberrant expression of mitochondrial proteins impairs cardiac function and causes heart disease. The mechanism of regulation of mitochondria encoded protein expression during cardiac disease, however, remains underexplored. Here, we show that multiple pathogenic cardiac stressors induce the expression of miR-574 guide and passenger strands (miR-574-5p/3p) in both humans and mice. miR-574 knockout mice exhibit severe cardiac disorder under different pathogenic cardiac stresses while miR-574-5p/3p mimics that are delivered systematically using nanoparticles reduce cardiac pathogenesis under disease insults. Transcriptomic analysis of miR-574-null hearts uncovers family with sequence similarity 210 member A (FAM210A) as a common target mRNA of miR-574-5p and miR-574-3p. The interactome capture analysis suggests that FAM210A interacts with mitochondrial translation elongation factor EF-Tu. Manipulating miR-574-5p/3p or FAM210A expression changes the protein expression of mitochondrial-encoded electron transport chain (ETC) genes but not nuclear-encoded mitochondrial ETC genes in both human AC16 cardiomyocyte cells and miR-574-null murine hearts. Together, we discovered that miR-574 regulates FAM210A expression and modulates mitochondrial-encoded protein expression, which may influence cardiac remodeling in heart failure.
Keywords: FAM210A; cardiac remodeling; gene regulation; microRNA; mitochondria.
© 2020 The Authors. Published under the terms of the CC BY 4.0 license.
Conflict of interest statement
The authors declare that they have no conflict of interest.
Figures

miRNA profiling identified miR‐574‐5p as the commonly upregulated miRNA in the hearts of aged mice, MI mice, and patients; and miR‐574‐3p is induced in exercised hearts and MI patients.
Sequence and location of miR‐574 gene in the human genome.
miR‐574‐5p and miR‐574‐3p were highly expressed in the explanted failing hearts from chronic HF patients (n = 17) versus donor non‐failing hearts (n = 6).
miR‐574‐5p and miR‐574‐3p were induced in the hearts of mice with isoproterenol (ISO) infusion (4 weeks; n = 10–12).
miR‐574‐5p and miR‐574‐3p were induced in the hearts of mice under transverse aortic constriction (TAC) surgery (4 weeks; n = 8–10).

- A
Northern blot detection of miR‐574‐5p/3p expression and RT–qPCR measurement of Fam210a mRNA expression in various murine organs (n = 3).
- B
miR‐574‐5p and miR‐574‐3p expression in adult CM and CF cells isolated from murine hearts of WT mice at baseline. Postn and Myh6 are used as cardiac fibroblast and cardiomyocyte marker, respectively. N = 3 per group.
- C
miR‐574‐5p and miR‐574‐3p expression in adult CM and CF cells isolated from murine hearts of WT mice undergoing TAC surgery after 3 days. N = 3 per group.
- D, E
Expression of miR‐574‐5p and miR‐574‐3p in the heart from mice undergoing TAC surgery at different time points. N = 3 per group.
- F
ISO induces miR‐574‐5p and miR‐574‐3p expression in isolated murine ACMs. N = 3 per group.

H&E of hearts from WT and miR‐574−/− mice with or without isoproterenol (ISO) treatment for 4 weeks. Mice were between 8–10 weeks old females.
Ratio of HW/TL (heart weight/tibia length) in WT and miR‐574−/− mice (n = 8/7/8/6 for 4 groups of WT, Veh.; WT, ISO; KO, Veh.; KO, ISO).
WGA (wheat germ agglutinin) staining in WT and miR‐574−/− mice. Cross‐sectional area (CSA) of CMs was measured and quantified (n ≥ 500 cells). Scale bar: 50 μm. In the violin plot, black line shows median value for the group and peach dashed lines represent two quartile lines in each group.
Picrosirius red staining in WT and miR‐574−/− mice (n = 6 per group). Scale bar: 1 mm.
RT–qPCR of fetal cardiac genes in WT and miR‐574−/− mice with ISO treatment (n = 3 per group). ANF, atrial natriuretic factor; BNP, B‐type natriuretic peptide; Myh6/Myh7, myosin heavy polypeptide 6/7; Col1a2/Col3a1, procollagen, type I, α2; type III, α1.
TUNEL assay for heart tissue sections from WT and miR‐574−/− mice under ISO versus vehicle treatment (n = 6 per group). Scale bar: 10 μm.

- A
Phalloidin staining of primary ACMs from WT and miR‐574−/− mice in response to isoproterenol (ISO) treatment (10 μM for 24 h). Data are obtained from 3 individual experiments (n> 100 CM cells/group). Scale bar: 50 μm.
- B
Trypan blue staining of primary ACMs from WT and miR‐574−/− mice under ISO (10 μM for 48 h) versus vehicle treatment. N = 5 per group. Scale bar: 100 μm.
- C, D
DHE staining of frozen sections of hearts from WT and miR‐574−/− mice under Veh. and ISO treatment or Sham and TAC operation (4 weeks post‐surgery). N = 5 per group for (C) and n = 8 per group for (D). Scale bar: 20 μm.
- E
TUNEL assay for heart tissue sections from WT and miR‐574−/− mice under Sham versus TAC surgery. N = 5 per group. Scale bar: 5 μm.
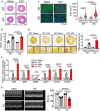
H&E staining of hearts from WT and miR‐574−/− mice 4 weeks after transverse aortic constriction (TAC) surgery.
Ratio of HW/TL in WT and miR‐574−/− mice (n = 8 per group).
WGA staining of hearts from WT and miR‐574−/− mice 4 weeks after TAC surgery (n ≥ 500 cells). Scale bar: 20 μm. In the violin plot, black line shows median value for the group and peach dashed lines represent two quartile lines in each group.
Picrosirius red staining of hearts from WT and miR‐574−/− mice under TAC surgery (n = 8 per group). Scale bar: 1 mm.
RT–qPCR of fetal cardiac genes in WT and miR‐574−/− mice with TAC surgery (n = 4 per group).
Echocardiography measurement of cardiac functions of hearts from WT and miR‐574−/− mice 4 weeks post‐TAC (n = 8 per group). FS, fractional shortening.
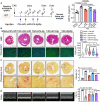
The schematic of therapeutic treatment of the TAC model using miRNA mimics followed by phenotypic characterizations. HW/TL ratio is measured (n = 4–10 per group). Ctrl‐miR: negative control miRNA mimics.
H&E and WGA staining of murine hearts in the therapeutic models. Scale bar: 1 mm for H&E and 50 μm for WGA. Cardiomyocyte surface area was quantified from WGA staining in the right panel. >120 CMs are quantified in each group. The black line shows medium value for the group and the dotted lines represent two quartile lines in each group.
Picrosirius red staining of murine hearts in the therapeutic models. Scale bar: 1 mm. The fibrotic area was quantified in the right panel (n = 4–10 per group).
Echocardiography analysis of the cardiac function of mice in the therapeutic models at the endpoint of 6 weeks post‐surgery (n = 4–10 per group).
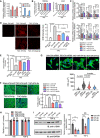
RT–qPCR of miR‐574‐5p and miR‐574‐3p after injections of the miRNA mimics for 2 or 4 days. N = 4 per group.
Creatine kinase test and alanine transaminase (ALT) assay in kidneys and livers from miRNA mimic injected mice. N = 4 per group. TAC: transverse aortic constriction; Sham is control mock surgery for TAC surgery (no constriction).
RT–qPCR of hypertrophy and fibrosis marker genes in the hearts of therapeutic mouse models. N = 5 per group.
DHE staining of frozen sections of hearts from WT mice under treatment with miRNA mimics in TAC‐induced HF mouse models. Sham operation was used as a control for TAC. N = 4 per group. Scale bar: 20 μm.
ATP level in heart lysates from WT mice under treatment with miRNA mimics in TAC‐induced HF mouse models (6 weeks post‐surgery). N = 4 per group.
TUNEL assay of murine hearts in the therapeutic models. N = 4 per group. Scale bar: 5 μm. Green color: α‐actinin immunostaining signal. Red color: TUNEL signal. Blue color: DAPI signal.
miR‐574‐5p and miR‐574‐3p decreased ISO‐activated mouse CM hypertrophy. Isolated mouse primary neonatal CMs were stained by FITC phalloidin. The cells were transfected with negative control miRNA, miR‐574‐3p, and miR‐574‐5p mimics, followed by ISO (10 μm) treatment for 24 h. N> 100 cells/group. Scale bar: 10 μm. The dashed line in the violin plot shows medium value for the group and the dotted lines represent two quartile lines in each group.
Mouse primary CF cell proliferation measured by the CyQUANT cell proliferation kit. N = 4 per group. NS: not significant (compared to Ctrl‐miR group).
Western blot measurement of α‐SMA in TGF‐β (10 ng/ml; 24 h) treated mouse primary CF cells. The protein expression was quantified from 4 biological replicates in the right panel. *P < 0.05; **P < 0.01; ***P < 0.001.

Volcano curve analysis of dysregulated genes in miR‐574−/− versus WT heart. The P adj is the P values adjusted for multiple testing with correction using the Benjamini–Hochberg procedure. The dots above the dashed line show P adj < 0.05.
Heatmap of significantly upregulated genes in miR‐574−/− mice at baseline analyzed by RNA‐Seq. P60 male mice, n = 3 per group, P adj < 0.05. The P adj is the P values adjusted for multiple testing with correction using the Benjamini–Hochberg procedure.
Gene Ontology analysis of enriched pathways of upregulated genes in RNA‐Seq. The top three pathways are listed with enriched gene sets.
Identification of Fam210a as a target of miR‐574‐5p and miR‐574‐3p. Seed sequence‐bearing target genes were predicted by TargetScan.
Expression of Fam210a mRNA in the heart of miR‐574−/− and WT mice from 3 biological replicates.
Expression of FAM210A protein in the heart of miR‐574−/− and WT mice. Protein intensity was quantified in the right panel (n = 6 per group).
Seed sequences of miR‐574‐5p and miR‐574‐3p in Fam210a mRNA 3’UTR (TargetScan) and their mutants.
Dual luciferase reporter assays with co‐transfection of miR‐574‐5p mimics and FLuc‐Fam210a 3’UTR bearing wild‐type and mutant seed sequences. The assays were performed in three biological replicates.
Dual luciferase reporter assays with co‐transfection of miR‐574‐3p mimics and FLuc‐Fam210a 3’UTR bearing wild‐type and mutant seed sequences. The assays were performed in three biological replicates.
- A
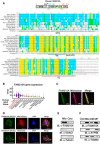
The schematic of FAM210A protein domain composition and evolutionary conservation of FAM210A protein sequence from 10 representative species analyzed by AlignX software. The yellow color shows completely conserved residues across all the species at a given position; the blue color indicates consensus residues derived from a block of similar residues at a given position, while the green color stands for the consensus residues derived from the occurrence of greater than 50% of a single residue at a given position. The green letters suggests weak similarity to consensus residues at a given position.
- B
The expression level of FAM210A mRNA in 15 human organs from the GTEx Portal database. TPM: transcripts per million of reads. The central band shows the median value, and the box indicates the first and third quartiles. The sample size of human samples used for quantification in GTEx Portal database (from testis to pancreas): n = 361/429/432/555/803/240/432/226/406/578/241/202/85/328/755.
- C
Cellular localization of FAM210A in primary mouse ACMs detected by IF. Scale bar: 30 μm.
- D
Cellular localization of recombinant FAM210A in human AC16 CM cells. FAM210A‐3xFlag expression plasmid was transfected into AC16 cells for 48 h. Scale bar: 40 μm.
- E
Immunoblot detection of FAM210A in isolated cytoplasmic and mitochondrial fractions from mouse hearts. VDAC1 and tubulin are used as fraction controls. Cyto: cytoplasm; Mito: mitochondria. A representative image is shown from three biological replicates.
- F
Sub‐organelle localization of FAM210A in isolated mouse cardiac mitochondria. TOM20 and ATP5B are used as the outer membrane (OM) and mitoplast (MP) markers, respectively.

- A
Antibody‐based affinity purification of endogenous FAM210A from purified murine cardiac mitochondria coupled with mass spectrometry analysis.
- B
Top list of FAM210A‐interacting proteins in IP‐MS (immunoprecipitation‐mass spectrometry) analysis. PSM: peptide spectrum match.
- C
Confocal imaging of co‐localization of FAM210A‐3xFLAG and endogenous EF‐Tu by immunostaining. Scale bar: 40 μm.
- D
Left panel: IP‐IB validates FAM210A‐interacting proteins using pre‐immune IgG and FAM210A antibodies. Right panel: IP‐IB validates FAM210A‐interacting proteins in HEK293T cell lysates subjected to IP using pre‐immune IgG and anti‐FLAG antibodies. A representative image is shown in three biological replicates.
- E
Mapping of interacting domains in FAM210A for binding EF‐Tu.
- F, G
Protein expression of mitochondrial ETC component genes was measured in AC16 cells after following treatments in comparison with control cells: (F) siRNA knockdown of FAM210A. (G) FAM210A overexpression. Quantitative data were shown in Appendix Fig S4A and B.
- A
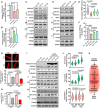
miR‐574‐5p and miR‐574‐3p overexpression reduced FAM210A mRNA expression in AC16 cells (n = 3 in each group).
- B
miR‐574‐5p and miR‐574‐3p inhibition increased FAM210A mRNA expression in AC16 cells (n = 3 in each group).
- C, D
Protein expression of mitochondrial ETC component genes was measured in AC16 cells after following treatments in comparison with control cells: (C) miR‐574‐5p or miR‐574‐3p overexpression. (D) Transfection of anti‐miR‐574‐5p or anti‐miR‐574‐3p inhibitor.
- E, F
Mitochondrial membrane potential and ATP production in AC16 cells under ISO treatment (10 μM for 24 h) with overexpression of miR‐574‐5p or miR‐574‐3p. >120 cells/group were quantified in (E) and n = 4 biological replicates in (F). The dashed line in the violin plot shows medium value for the group, and the dotted lines represent two quartile lines in each group.
- G, H
Mitochondrial membrane potential and ATP production in primary mouse ACMs isolated from WT and miR‐574−/− mice under ISO treatment. Scale bar: 10 μm. >110 cells/group were quantified in bottom panel of (G) and n = 5 in (H).
- I
Transfection of miR‐574‐5p/3p in the absence or presence of FAM210A overexpression. All the Western blot images were provided as representative data from 3 to 4 biologically replicated experiments. Quantitative data were shown in Fig EV4H.
- J
Increased protein expression of FAM210A and ND1 in miR‐574 KO hearts compared to WT hearts upon TAC surgery. N = 5 hearts (~110–150 CM cells) were measured per group. The dashed line in the violin plot shows medium value for the group and the dotted lines represent two quartile lines in each group.
- K
The schematic model of the cardioprotective function and mechanism of miR‐574‐FAM210A axis against cardiac pathological remodeling.
- A, B
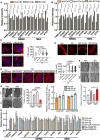
Quantitative analysis of Western blot data from Fig 8C and D. n.d., not detected. Each experiment was done in triplicates.
- C
ISO (isoproterenol)‐induced cardiomyocyte hypertrophy indicated by phalloidin staining in human AC16 CM cells treated with miRNA mimics (100 nM for 24 h). N> 110 cells/group. Scale bar: 10 μm. The black line in the violin plot shows medium value for the group and the dotted lines represent two quartile lines in each group.
- D
ISO‐induced CM hypertrophy in AC16 cells treated with anti‐miR inhibitors (10 μM ISO and 100 nM anti‐miR inhibitor treatment for 24 h). N = 110–150 cells/group. Scale bar: 10 μm.
- E
Representative TMRE staining images of AC16 CM cells. Scale bar: 10 μm.
- F, G
Transmission electron microscopy analysis of mitochondrial surface area and cristae number. 60–150 mitochondria were quantified from 3 hearts. Scale bar: 1 μm and 0.5 μm. **P < 0.01.
- H
Quantitative analysis of Western blot data from Fig 8I. Each experiment was done in triplicates. Control AC16 cells and cells with FAM210A stable overexpression were treated with 10 μM ISO for 24 h, followed by transfection of 100 nM of miRNA mimics. *P < 0.05; **P < 0.01; ***P < 0.001.
- I
Measurement of mitochondrial copy number in AC16 cells transfected with Ctrl‐miR, miR‐574‐5p, miR‐574‐3p in the presence or absence of FAM210A overexpression. N = 3 per group.
- A, B
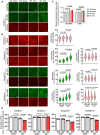
IF analysis of protein expression of ETC complex protein components in WT and miR‐574 KO hearts 3 days after TAC surgery. n = 5 hearts per group with> 100 CMs measured per group. Scale bar: 10 μm. The dashed line in the violin plot shows medium value for the group and the dotted lines represent two quartile lines in each group.
- C
Measurement of mitochondrial copy number in WT and miR‐574 KO hearts 3 days after TAC surgery (n = 4).
- D
Measurement of mitochondrial electron transport chain complex enzymatic activities in heart lysates of WT and miR‐574 KO mice at 4 weeks after TAC or Sham surgery (n = 5 per group).
Similar articles
-
FAM210A regulates mitochondrial translation and maintains cardiac mitochondrial homeostasis.Cardiovasc Res. 2023 Nov 15;119(14):2441-2457. doi: 10.1093/cvr/cvad124. Cardiovasc Res. 2023. PMID: 37522353 Free PMC article.
-
FAM210A Regulates Mitochondrial Translation and Maintains Cardiac Mitochondrial Homeostasis.bioRxiv [Preprint]. 2023 May 22:2023.05.20.541585. doi: 10.1101/2023.05.20.541585. bioRxiv. 2023. Update in: Cardiovasc Res. 2023 Nov 15;119(14):2441-2457. doi: 10.1093/cvr/cvad124 PMID: 37293097 Free PMC article. Updated. Preprint.
-
MicroRNA-27b-3p down-regulates FGF1 and aggravates pathological cardiac remodelling.Cardiovasc Res. 2022 Jul 20;118(9):2139-2151. doi: 10.1093/cvr/cvab248. Cardiovasc Res. 2022. PMID: 34358309 Free PMC article.
-
Expression and purification of the mitochondrial transmembrane protein FAM210A in Escherichia coli.Protein Expr Purif. 2023 Oct;210:106322. doi: 10.1016/j.pep.2023.106322. Epub 2023 Jun 15. Protein Expr Purif. 2023. PMID: 37329934 Free PMC article.
-
FAM210A: An emerging regulator of mitochondrial homeostasis.Bioessays. 2024 Oct;46(10):e2400090. doi: 10.1002/bies.202400090. Epub 2024 Aug 19. Bioessays. 2024. PMID: 39159484 Review.
Cited by
-
Non-Canonical Targets of MicroRNAs: Role in Transcriptional Regulation, Disease Pathogenesis and Potential for Therapeutic Targets.Microrna. 2024;13(2):83-95. doi: 10.2174/0122115366278651240105071533. Microrna. 2024. PMID: 38317474 Review.
-
Cardiomyocyte-Specific Loss of Glutamyl-prolyl-tRNA Synthetase Leads to Disturbed Protein Homeostasis and Dilated Cardiomyopathy.Cells. 2023 Dec 22;13(1):35. doi: 10.3390/cells13010035. Cells. 2023. PMID: 38201239 Free PMC article.
-
Potential Roles of microRNAs for Assessing Cardiovascular Risk in Pre-Eclampsia-Exposed Postpartum Women and Offspring.Int J Mol Sci. 2023 Nov 28;24(23):16842. doi: 10.3390/ijms242316842. Int J Mol Sci. 2023. PMID: 38069164 Free PMC article. Review.
-
Native lamin A/C proteomes and novel partners from heart and skeletal muscle in a mouse chronic inflammation model of human frailty.Front Cell Dev Biol. 2023 Oct 23;11:1240285. doi: 10.3389/fcell.2023.1240285. eCollection 2023. Front Cell Dev Biol. 2023. PMID: 37936983 Free PMC article.
-
Circular RNA cFAM210A, degradable by HBx, inhibits HCC tumorigenesis by suppressing YBX1 transactivation.Exp Mol Med. 2023 Nov;55(11):2390-2401. doi: 10.1038/s12276-023-01108-8. Epub 2023 Nov 1. Exp Mol Med. 2023. PMID: 37907737 Free PMC article.
References
-
- Ambrosy AP, Fonarow GC, Butler J, Chioncel O, Greene SJ, Vaduganathan M, Nodari S, Lam CSP, Sato N, Shah AN et al (2014) The global health and economic burden of hospitalizations for heart failure: lessons learned from hospitalized heart failure registries. J Am Coll Cardiol 63: 1123–1133 - PubMed
-
- Benjamin EJ, Virani SS, Callaway CW, Chamberlain AM, Chang AR, Cheng S, Chiuve SE, Cushman M, Delling FN, Deo R et al (2018) Heart Disease and Stroke Statistics‐2018 Update: A Report From the American Heart Association. Circulation 137: e67–e492 - PubMed
Publication types
MeSH terms
Substances
Associated data
- Actions
Grants and funding
LinkOut - more resources
Full Text Sources
Molecular Biology Databases


