iBet uBet web content aggregator. Adding the entire web to your favor.


Link to original content: http://pubmed.ncbi.nlm.nih.gov/33210087/
New Illumination and Temperature Constraints of Mercury's Volatile Polar Deposits - PubMed Skip to main page content
U.S. flag

An official website of the United States government

Dot gov

The .gov means it’s official.
Federal government websites often end in .gov or .mil. Before sharing sensitive information, make sure you’re on a federal government site.

Https

The site is secure.
The https:// ensures that you are connecting to the official website and that any information you provide is encrypted and transmitted securely.

Access keys NCBI Homepage MyNCBI Homepage Main Content Main Navigation
. 2020 Dec;1(3):57.
doi: 10.3847/psj/abb1c2. Epub 2020 Oct 26.

New Illumination and Temperature Constraints of Mercury's Volatile Polar Deposits

Affiliations

New Illumination and Temperature Constraints of Mercury's Volatile Polar Deposits

Colin D Hamill et al. Planet Sci J. 2020 Dec.

Abstract

Images from the Mercury Dual Imaging System (MDIS) aboard the MErcury Surface, Space ENvironment, GEochemistry, and Ranging mission reveal low-reflectance polar deposits that are interpreted to be lag deposits of organic-rich, volatile material. Interpretation of these highest-resolution images of Mercury's polar deposits has been limited by the available topography models, so local high-resolution (125 m pixel-1) digital elevation models (DEMs) were made using a combination of data from the Mercury Laser Altimeter (MLA) and from shape-from-shading techniques using MDIS images. Local DEMs were made for eight of Mercury's north polar craters; these DEMs were then used to create high-resolution simulated image, illumination, and thermal models. The simulated images reveal that the pixel brightness variations imaged within Mercury's low-reflectance deposits are consistent with scattered light reflecting off of topography and do not need to be explained by volatile compositional differences as previously suggested. The illumination and thermal models show that these low-reflectance polar deposits extend beyond the permanently shadowed region, more than 1.0 km in some locations, and correspond to a maximum surface temperature of greater than 250 K but less than 350 K. The low-reflectance boundaries of all eight polar deposits studied here show a close correspondence with the surface stability boundary of coronene (C24H12). While coronene should only be viewed as a proxy for the myriad volatile compounds that may exist in Mercury's polar deposits, coronene's surface stability boundary supports the idea that Mercury's low-reflectance polar deposits are composed of macromolecular organic compounds, consistent with the hypotheses of exogenous transport and in situ production.


Figures

Figure A1.
Figure A1.
All high-resolution (125 m pixel−1) DEMs made for this study of Mercury’s north polar deposits. These DEMs were made using a combination of MLA data and SfS techniques using MDIS images.
Figure A2.
Figure A2.
All WAC broadband images gathered for Angelou (18 km diameter).
Figure A3.
Figure A3.
All WAC broadband images gathered for Bechet (18 km diameter).
Figure A4.
Figure A4.
All WAC broadband images gathered for Desprez (47 km diameter).
Figure A5.
Figure A5.
All WAC broadband images gathered for Ensor (25 km diameter).
Figure A6.
Figure A6.
All WAC broadband images gathered for Fuller (27 km diameter).
Figure A7.
Figure A7.
All WAC broadband images gathered for Jimenez (27 km diameter).
Figure A8.
Figure A8.
All WAC broadband images gathered for Josetsu (30 km diameter). The blue rectangle in the first image denotes the transect used in Figure 11(g).
Figure A9.
Figure A9.
All WAC broadband images gathered for Laxness (26 km diameter).
Figure A10.
Figure A10.
(a) Simulated image for EW1067153675B of Angelou (18 km diameter) at 125 m pixel−1, (b) with dark regions outlined in red. (c) WAC broadband image EW1067153675B (24 m pixel−1) of Angelou, (d) with dark regions outlined from the simulated image overlaid on top of the WAC image (red).
Figure A11.
Figure A11.
(a) Simulated image for EW1068017656B of Bechet (18 km diameter) at 125 m pixel−1, (b) with dark regions outlined in red. (c) WAC broadband image EW1068017656B (56 m pixel−1) of Bechet, (d) with dark regions outlined from the simulated image overlaid on top of the WAC image (red).
Figure A12.
Figure A12.
(a) Simulated image for EW1051458815B of Ensor (25 km diameter) at 125 m pixel−1, (b) with dark regions outlined in red. (c) WAC broadband image EW1051458815B (38 m pixel−1) of Ensor, (d) with dark regions outlined from the simulated image overlaid on top of the WAC image (red).
Figure A13.
Figure A13.
(a) Simulated image for EW1053866171B of Jimenez (27 km diameter) at 125 m pixel−1, (b) with dark regions outlined in red. (c) WAC broadband image EW1053866171B (75 m pixel−1) of Jimenez, (d) with dark regions outlined from the simulated image overlaid on top of the WAC image (red).
Figure A14.
Figure A14.
(a) Simulated image for EW1053225572B of Josetsu (30 km diameter) at 125 m pixel−1, (b) with dark regions outlined in red. (c) WAC broadband image EW1053225572B (61 m pixel−1) of Josetsu, (d) with dark regions outlined from the simulated image overlaid on top of the WAC image (red).
Figure A15.
Figure A15.
(a) Simulated image for EW1052586891B of Laxness (26 km diameter) at 125 m pixel−1, (b) with dark regions outlined in red. (c) WAC broadband image EW1052586891B (48 m pixel−1) of Laxness, (d) with dark regions outlined from the simulated image overlaid on top of the WAC image (red).
Figure A16.
Figure A16.
(a) WAC broadband image EW1068375172B of Desprez (47 km diameter) and (b) simulated image for the same image of Desprez. (c) A ratio (WAC image divided by simulated image) that shows how the simulated image predicts the brightness variations within Desprez’ low-reflectance polar deposit.
Figure A17.
Figure A17.
(a) WAC broadband image EW1051776921B (24 m pixel−1) of Angelou’s low-reflectance polar deposit. The blue rectangle denotes the transect used in Figure A1(a). (b) Outline of Angelou’s PSR (red). (c) Outline of PSR (red) and 250, 300, and 350 K maximum surface temperatures (green, blue, and purple). (d) Outline of region where coronene (C24H12) is thermally stable on the surface (orange).
Figure A18.
Figure A18.
(a) WAC broadband image EW1068017656B (56 m pixel−1) of Bechet’s low-reflectance polar deposit. The blue rectangle denotes the transect used in Figure A1(b). (b) Outline of Bechet’s PSR (red). (c) Outline of PSR (red) and 250, 300, and 350 K maximum surface temperatures (green, blue, and purple). (d) Outline of region where coronene (C24H12) is thermally stable on the surface (orange).
Figure A19.
Figure A19.
(a) WAC broadband image EW1068375172B (72 m pixel−1) of Desprez’ low-reflectance polar deposit. The blue rectangle denotes the transect used in Figure A1(c). (b) Outline of Desprez’ PSR (red). (c) Outline of PSR (red) and 250, 300, and 350 K maximum surface temperatures (green, blue, and purple). (d) Outline of region where coronene (C24H12) is thermally stable on the surface (orange).
Figure A20.
Figure A20.
(a) WAC broadband image EW1067123925B (51 m pixel−1) of Fuller’s low-reflectance polar deposit. The blue rectangle denotes the transect used in Figure A1(e). (b) Outline of Fuller’s PSR (red). (c) Outline of PSR (red) and 250, 300, and 350 K maximum surface temperatures (green, blue, and purple). (d) Outline of region where coronene (C24H12) is thermally stable on the surface (orange).
Figure A21.
Figure A21.
(a) WAC broadband image EW1053225572B (61 m pixel−1) of Josetsu’s low-reflectance polar deposit. (b) Outline of Josetsu’s PSR (red). (c) Outline of PSR (red) and 250, 300, and 350 K maximum surface temperatures (green, blue, and purple). (d) Outline of region where coronene (C24H12) is thermally stable on the surface (orange).
Figure A22.
Figure A22.
(a) WAC broadband image EW1052586891B (48 m pixel−1) of Laxness’ low-reflectance polar deposit. The blue rectangle denotes the transect used in Figure A1(h). (b) Outline of Laxness’ PSR (red). (c) Outline of PSR (red) and 250, 300, and 350 K maximum surface temperatures (green, blue, and purple). (d) Outline of region where coronene (C24H12) is thermally stable on the surface (orange).
Figure 1.
Figure 1.
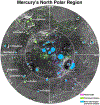
Map of Mercury’s north polar region with radar-bright-only regions (pink), regions of permanent shadow only (green), and regions that are both radar-bright and permanently shadowed (blue), from Deutsch et al. (2016). The eight craters investigated in this study are labeled.
Figure 2.
Figure 2.
DEMs of Ensor (25 km diameter). (a) North polar DEM at 500 m pixel−1. (b) High-resolution DEM using MLA tracks only. (c) High-resolution DEM using MLA tracks and SfS.
Figure 3.
Figure 3.
High-resolution models of Ensor (25 km diameter). (a) MLA + SfS DEM. (b) Average illumination over one Mercury solar day. The majority of the black region represents the PSR, as illustrated in Section 3.2. (c) Maximum surface temperature throughout a Mercury solar day. (d) Depth below the surface needed for the long-term stability of coronene (C24H12). The black region represents where coronene is thermally stable at the surface.
Figure 4.
Figure 4.
(a) Simulated image for EW1067123925B of Fuller (27 km diameter) at 125 m pixel−1, (b) with dark regions outlined in red. (c) WAC broadband image EW1067123925B (51 m pixel−1) of Fuller, (d) with dark regions outlined from the simulated image overlaid on top of the WAC image (red). The purple arrows indicate the position of the polar deposit’s low-reflectance boundary as seen in the WAC image.
Figure 5.
Figure 5.
(a) Simulated image for EW1068375172B of Desprez (47 km diameter) at 125 m pixel−1, (b) with bright regions outlined in red. (c) WAC broadband image EW1068375172B (72 m pixel−1) of Desprez, (d) with bright regions outlined from the simulated image overlaid on top of the WAC image (red). The purple arrows indicate the position of the polar deposit’s low-reflectance boundary as seen in the WAC image.
Figure 6.
Figure 6.
(a) WAC broadband image EW1051458815B (38 m pixel−1) of Ensor’s low-reflectance polar deposit. The blue rectangle denotes the transect used in Figure 10(d). (b) Outline of Ensor’s PSR (red). (c) Outline of PSR (red) and 250, 300, and 350 K maximum surface temperatures for a Mercury solar day (green, blue, and purple). (d) WAC broadband image EW1046946306B of Ensor’s low-reflectance polar deposit. (e) Outline of Ensor’s PSR (red). (f) Outline of Ensor’s PSR (red) and 250, 300, and 350 K maximum surface temperatures for a Mercury solar day (green, blue, and purple).
Figure 7.
Figure 7.
Comparison of maximum incident flux (W m−2) and maximum surface temperature (K) for the high-resolution models of Ensor.
Figure 8.
Figure 8.
WAC broadband image EW1051458815B (38 m pixel−1) of Ensor. (a) Outline of region where sulfur (S) (red), (b) anthracene (C14H10) (blue), or (c) coronene (C24H12) (orange) is thermally stable on the surface.
Figure 9.
Figure 9.
(a) WAC broadband image EW1053866171B (75 m pixel−1) of Jimenez’s low-reflectance polar deposit. The blue rectangle denotes the transect used in Figure 10(f). (b) Outline of Jimenez’s PSR (red). (c) Outline of PSR (red) and 250, 300, and 350 K maximum surface temperatures (green, blue, and purple). (d) Outline of region where coronene (C24H12) is thermally stable on the surface (orange).
Figure 10.
Figure 10.
Illumination and temperature conditions of Mercury’s polar deposit boundaries for each crater studied. The boundary of the PSR is set at a distance of zero and derived from the average direct illumination model (red); the shaded region represents the location of the low-reflectance polar deposit boundary determined from the WAC broadband images in DN values (blue). The maximum surface temperatures (black) indicate that each polar deposit boundary corresponds roughly to 250–350 K.

Similar articles

  • Imaging Mercury's Polar Deposits during MESSENGER's Low-altitude Campaign.
    Chabot NL, Ernst CM, Paige DA, Nair H, Denevi BW, Blewett DT, Murchie SL, Deutsch AN, Head JW, Solomon SC. Chabot NL, et al. Geophys Res Lett. 2016 Sep 28;43(18):9461-9468. doi: 10.1002/2016GL070403. Epub 2016 Sep 17. Geophys Res Lett. 2016. PMID: 28943677 Free PMC article.
  • Investigating Mercury's South Polar Deposits: Arecibo Radar Observations and High-resolution Determination of Illumination Conditions.
    Chabot NL, Shread EE, Harmon JK. Chabot NL, et al. J Geophys Res Planets. 2018 Feb;123(2):666-681. doi: 10.1002/2017JE005500. Epub 2018 Feb 28. J Geophys Res Planets. 2018. PMID: 29552436 Free PMC article.
  • Comparison of areas in shadow from imaging and altimetry in the north polar region of Mercury and implications for polar ice deposits.
    Deutsch AN, Chabot NL, Mazarico E, Ernst CM, Head JW, Neumann GA, Solomon SC. Deutsch AN, et al. Icarus. 2016 Jun;280:158-171. doi: 10.1016/j.icarus.2016.06.015. Epub 2016 Jun 25. Icarus. 2016. PMID: 29332948 Free PMC article.
  • Minamata disease: a story of mercury's malevolence.
    Powell PP. Powell PP. South Med J. 1991 Nov;84(11):1352-8. doi: 10.1097/00007611-199111000-00014. South Med J. 1991. PMID: 1948221 Review. No abstract available.
  • SERENA: Particle Instrument Suite for Determining the Sun-Mercury Interaction from BepiColombo.
    Orsini S, Livi SA, Lichtenegger H, Barabash S, Milillo A, De Angelis E, Phillips M, Laky G, Wieser M, Olivieri A, Plainaki C, Ho G, Killen RM, Slavin JA, Wurz P, Berthelier JJ, Dandouras I, Kallio E, McKenna-Lawlor S, Szalai S, Torkar K, Vaisberg O, Allegrini F, Daglis IA, Dong C, Escoubet CP, Fatemi S, Fränz M, Ivanovski S, Krupp N, Lammer H, Leblanc F, Mangano V, Mura A, Nilsson H, Raines JM, Rispoli R, Sarantos M, Smith HT, Szego K, Aronica A, Camozzi F, Di Lellis AM, Fremuth G, Giner F, Gurnee R, Hayes J, Jeszenszky H, Tominetti F, Trantham B, Balaz J, Baumjohann W, Brienza D, Bührke U, Bush MD, Cantatore M, Cibella S, Colasanti L, Cremonese G, Cremonesi L, D'Alessandro M, Delcourt D, Delva M, Desai M, Fama M, Ferris M, Fischer H, Gaggero A, Gamborino D, Garnier P, Gibson WC, Goldstein R, Grande M, Grishin V, Haggerty D, Holmström M, Horvath I, Hsieh KC, Jacques A, Johnson RE, Kazakov A, Kecskemety K, Krüger H, Kürbisch C, Lazzarotto F, Leblanc F, Leichtfried M, Leoni R, Loose A, Maschietti D, Massetti S, Mattioli F, Miller G, Moissenko D, Morbidini A, Noschese R, Nuccilli F, Nunez C, Paschalidis N, Persyn S, Piazza D, Oja M, Ryno J, Schmidt W, Scheer JA, Shestakov A, Shuvalov… See abstract for full author list ➔ Orsini S, et al. Space Sci Rev. 2021;217(1):11. doi: 10.1007/s11214-020-00787-3. Epub 2021 Jan 12. Space Sci Rev. 2021. PMID: 33487762 Free PMC article. Review.

References

    1. Alexandrov O, & Beyer RA 2018, E&SS, 5, 652
    1. Beyer RA, Alexandrov O, & McMichael S 2018, E&SS, 5, 537
    1. Botta O, & Bada JL 2002, SGeo, 23, 411
    1. Butler BJ, Muhleman DO, Slade MA, et al. 1993, JGR, 98, 15003
    1. Cavanaugh JF, Smith JC, Sun X, et al. 2007, SSRv, 131, 451

LinkOut - more resources